Copyright: © 2023 by the authors. Licensee: Pirogov University.
This article is an open access article distributed under the terms and conditions of the Creative Commons Attribution license (CC BY).

ORIGINAL RESEARCH

Clinical and virological characteristics of chronic hepatitis B and response to antiviral therapy

Nguyen Thi-Hanh1, Melnikova LI2, Ilchenko LYu1,3, Kyuregyan KK4, Gordeychuk IV3, Bondarenko NL2
About authors

1 Pirogov Russian National Research Medical University, Moscow, Russia

2 Clinical Hospital № 85 of Federal Medical-Biological Agency, Moscow, Russia

3 Chumakov Federal Scientific Center for Research and Development of Immune-and-Biological Products, Moscow, Russia

4 Mechnikov Research Institute of Vaccines and Sera, Moscow, Russia

Correspondence should be addressed: Nguyen Thi-Hanh
Akademika Volgina, 39, Moscow, 117437, Russia; ur.liam@hnahrd

About paper

Author contribution: Nguyen Thi-Hanh — sample collection, data analysis, manuscript writing; Melnikova LI — sample collection, data analysis; Ilchenko LYu — study design, data analysis, manuscript editing; Kyuregyan KK — literature review; Gordeychuk IV — data analysis; Bondarenko NL — editing and approval of the final version of the article.

Compliance with ethical standards: the study was approved by the Ethics Committee of Pirogov Russian National Research Medical University (protocol № 213 of 13 December 2021).
Received: 2022-12-08 Accepted: 2023-02-17 Published online: 2023-03-05
|
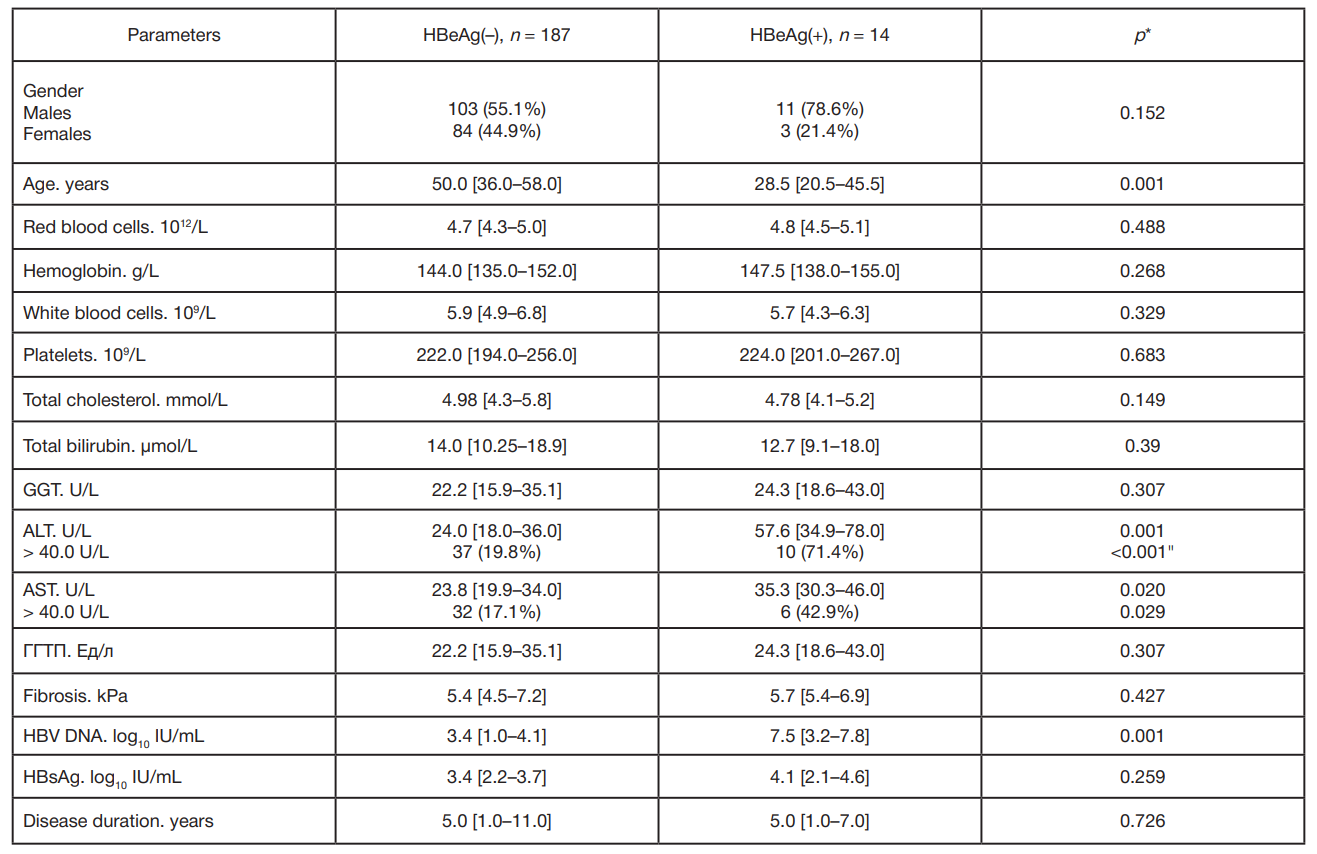
Table 1. Comparative characteristics of HBeAg(+) and HBeAg(–) patients
Note: the data are presented as МЕ [25th and 75th percentiles] or n/N (%); *p — significance level.
Table 2. Antiviral drugs used for treatment of CHB (n = 66)
Note: ETV — entecavir; TBV — telbivudine; TDF — tenofovir disoproxil fumarate; LAM — lamivudine; PEG-IFN-α-2a — pegylated interferon α-2а; * — AVT in 2009–2011; * * — TBV for 12 months in 2009–2010, then ETV.
Table 3. Comparative characteristics of HBeAg(+) and HBeAg(–) patients who received NAs
Note: the data are presented as МЕ [25th and 75th percentiles] or n/N (%); *p — significance level.
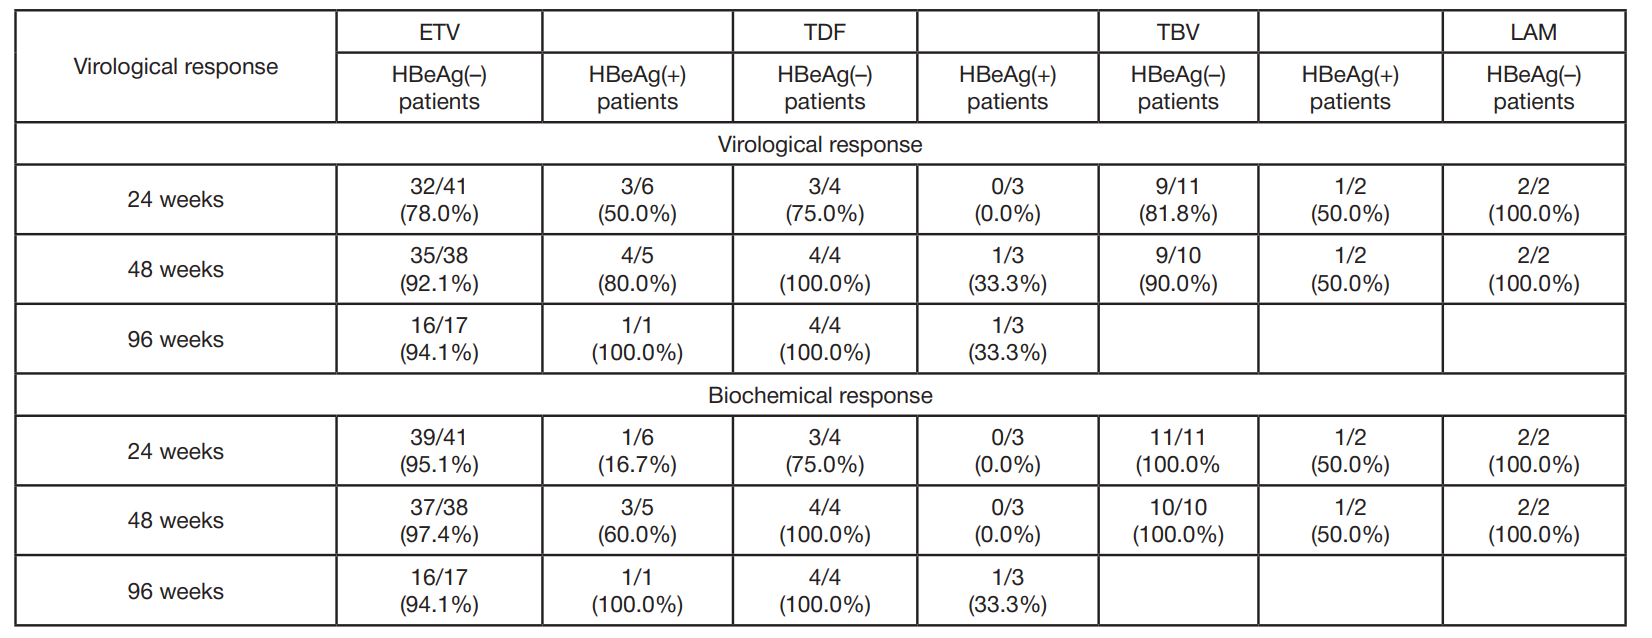
Table 4. Comparative efficiency of antiviral therapy with NAs
Note: the data are presented as n/N (%).
Table 5. Comparative efficiency of antiviral therapy with NAs in the HBeAg(+) and HBeAg(–) patients
Note: the data are presented as n/N (%); *p — significance level.
Table 6. Univariate and multivariate analysis of the raw factors associated with VR after 48 weeks of therapy with the nucleos(t)ide analogues
Note: *p — significance level.