ORIGINAL RESEARCH

Computational phantom for the dosimetry of the red bone marrow of a 10-year-old child due to incorporated beta-emitters

About authors

1 Urals Research Center for Radiation Medicine of the Federal Medical-Biological Agency, Chelyabinsk, Russia

2 Chelyabinsk State University, Chelyabinsk, Russia

Correspondence should be addressed: Pavel A. Sharagin
Vorovskogo, 68-а, Chelyabinsk, 454141, Russia; ur.mrcru@nigarahs

About paper

Funding: the study was performed within the framework of the Federal Targeted Program "Ensuring Nuclear and Radiation Safety for 2016–2020 and for the Period up to 2035" and supported by the Federal Medical Biological Agency of Russia.

Author contribution: Sharagin PA — data acquisition, analysis, and interpretation; manuscript drafting and revising. Tolstykh EI — study methodology elaboration, manuscript revising and approval; Shishkina EA — study design and concept development, manuscript revising and approval.
Received: 2024-05-20 Accepted: 2024-06-21 Published online: 2024-06-29
|
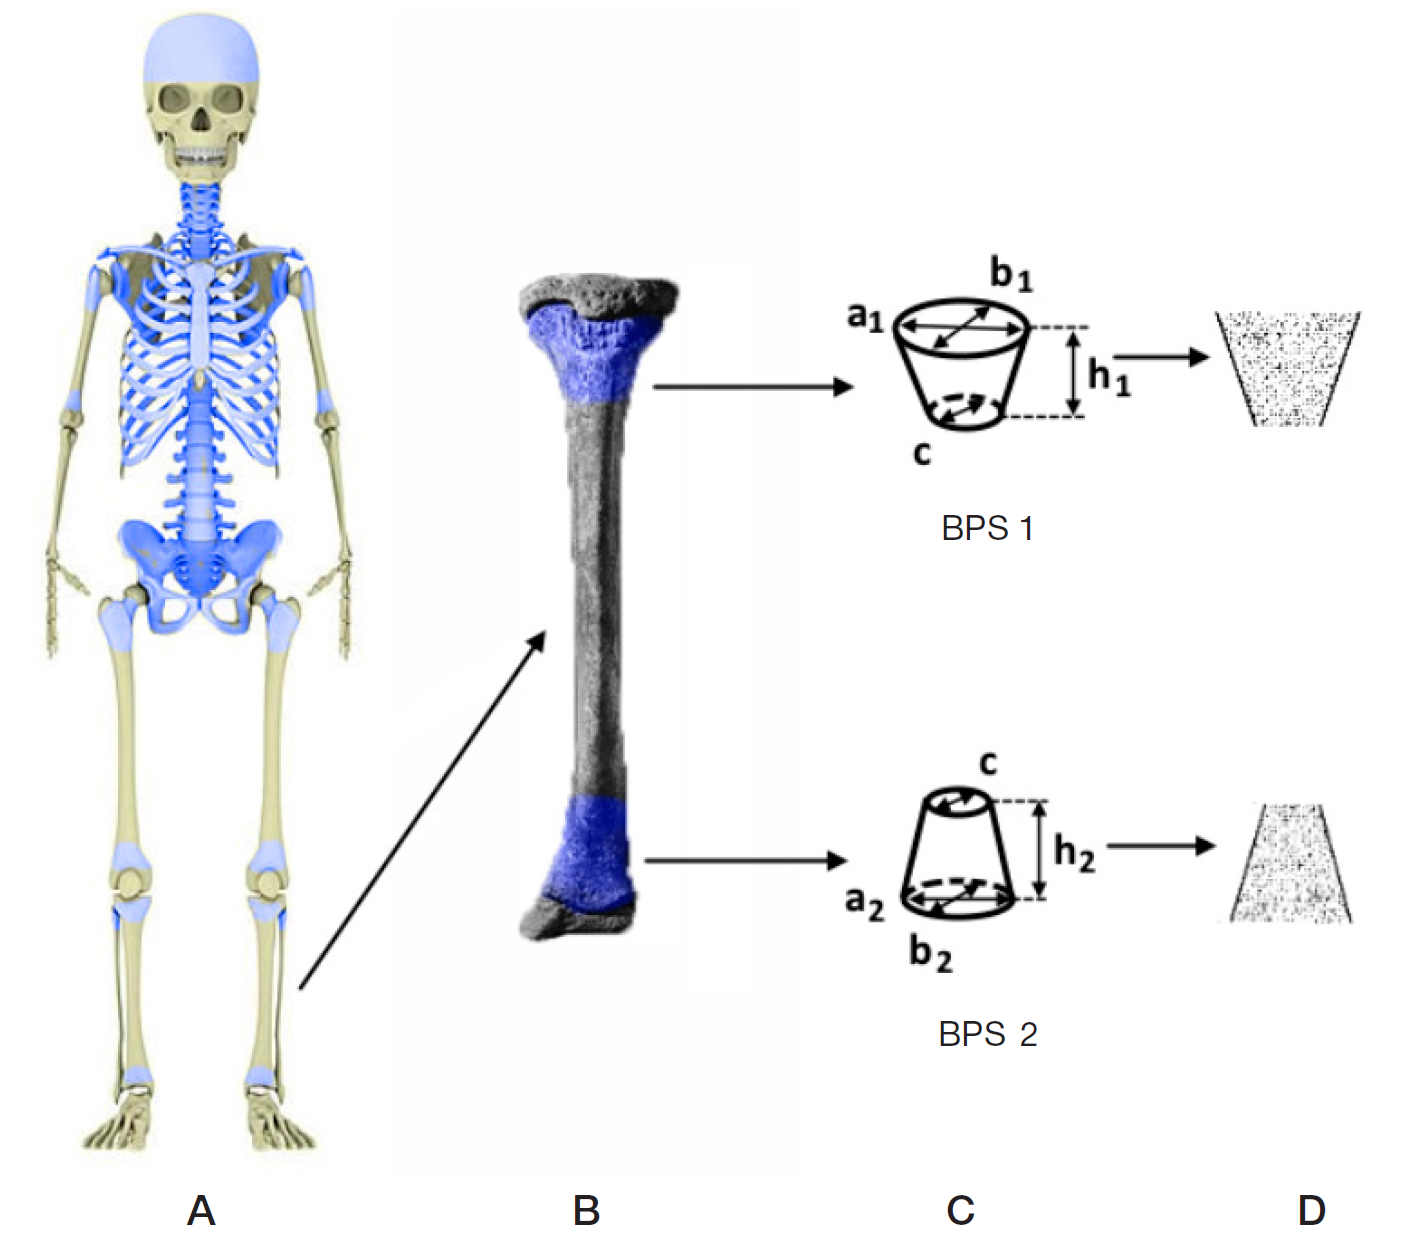
Fig. 1. Segmentation of the skeletal hematopoietic sites of a ten-year-old child using the example of the tibia. А. Skeleton of a ten-year-old child (modeled skeletal sites with active hematopoiesis are highlighted in blue). B. Tibia (modeled skeletal sites with active hematopoiesis are highlighted in blue). C. Scheme of bone division into BPS and BPS linear dimensions. D. BPS of the tibia — voxel representation, cross section (voxels simulating bone tissue are highlighted in black, those simulating RBM are highlighted in white)
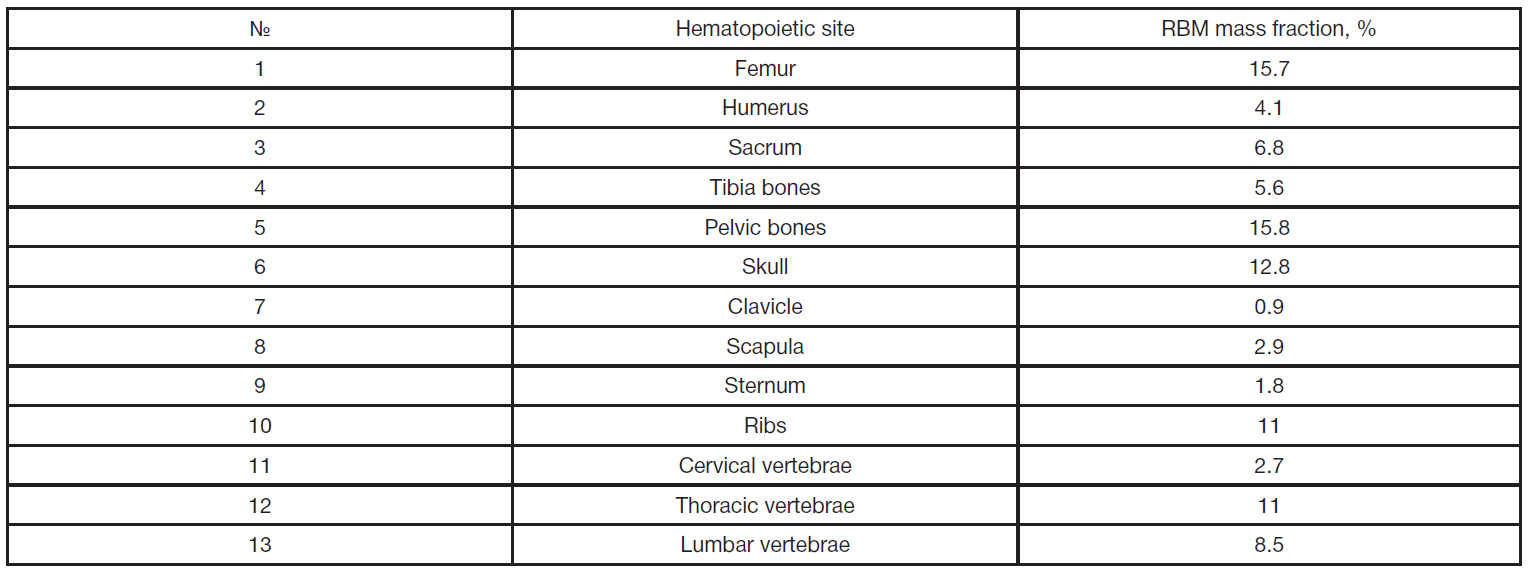
Table 1. Mass fraction of RBM (% of the total mass of RBM in the skeleton) in the main hematopoietic sites of a ten-year-old child’s skeleton [13, 22]
Table 2. Chemical composition of simulated media adopted for all BPS
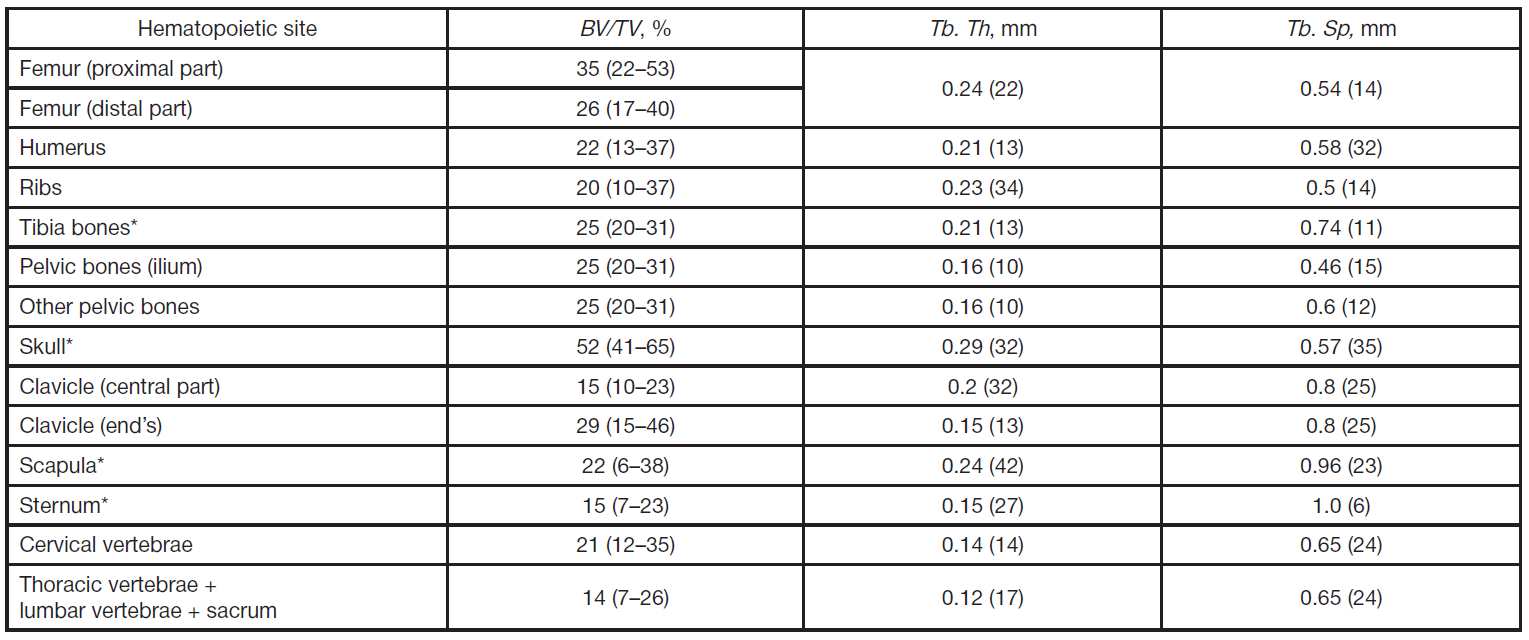
Table 3. Micro-architecture parameters assumed for BPS of a ten-year-old-child [11, 34–56] (coefficient of variation (CV) is given in parentheses, %)
Note: * — micro-architecture parameters were calculated based on the measurement results of similar bones or based on the data for other age groups; the calculation method was reported previously in [23].
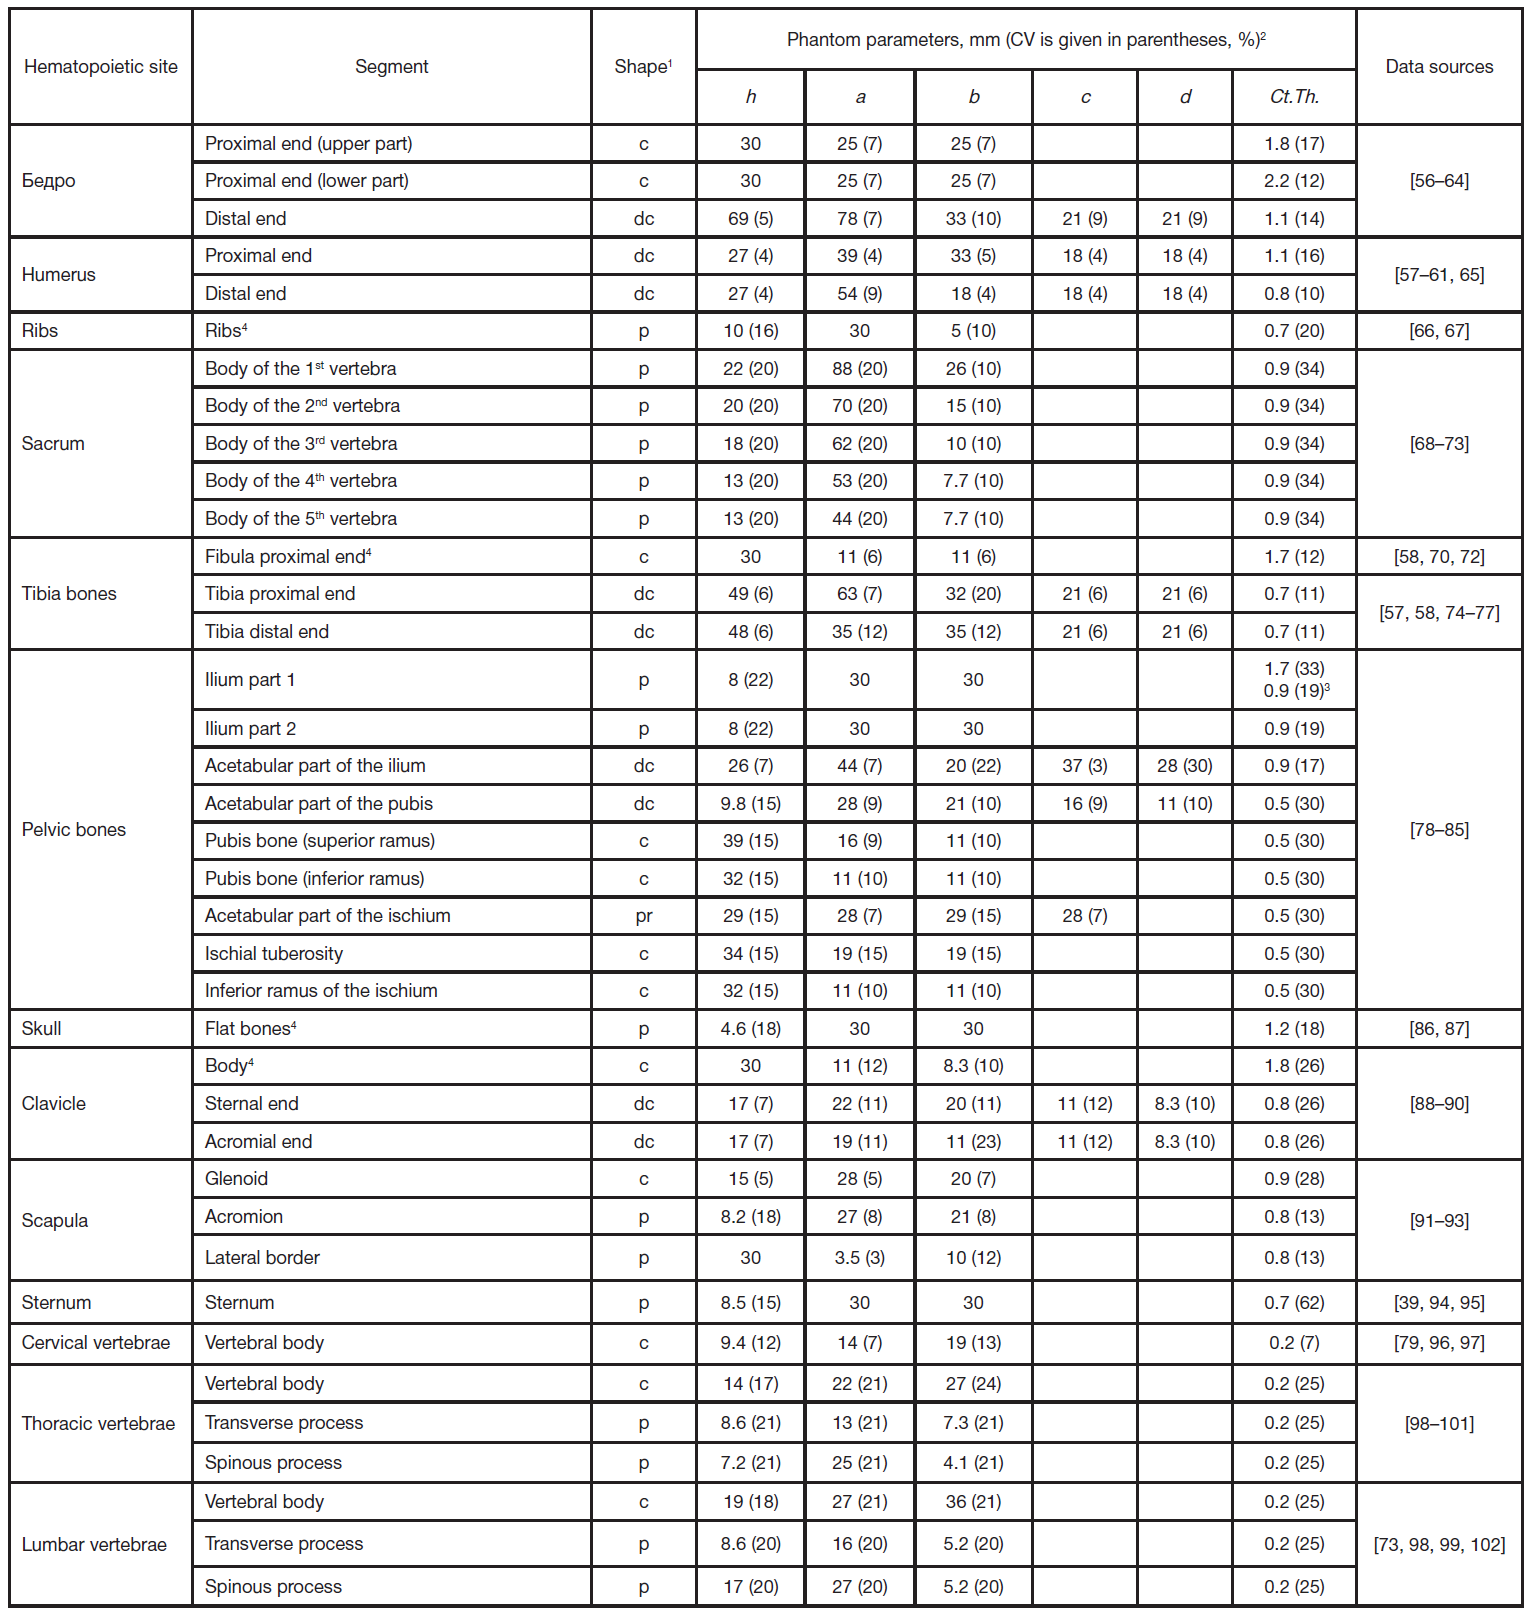
Table 4. Linear dimensions and cortical layer thickness assumed for the BPS representing a ten-year-old child
Note: 1 — phantom shape was designated as follows: c — cylinder, dc — deformed cylinder, p — rectangular parallelepiped, 2 pr – prism with triangle base — BPS dimensions were designated as follows: h — height; a — major axis (c), major axis for a larger base (dc) or side а (p); b — minor axis (c), minor axis for a large base (dc) or side b (p); с — major axis for a small base (dc); d — minor axis for a small base (dc); for prism (pr): a, b, c — the sides of the prism base; 3 — cortical layer thickness was considered to be different for the inner (medial) and outer (gluteal) surfaces of this segment of the ilium; 4 — BPS imitated only a part of the simulated bone segment, when the bone segment dimensions significantly exceeded 30 mm, since in such cases it makes no sense to simulate the entire bone fragment in terms of dosimetry [15, 24].
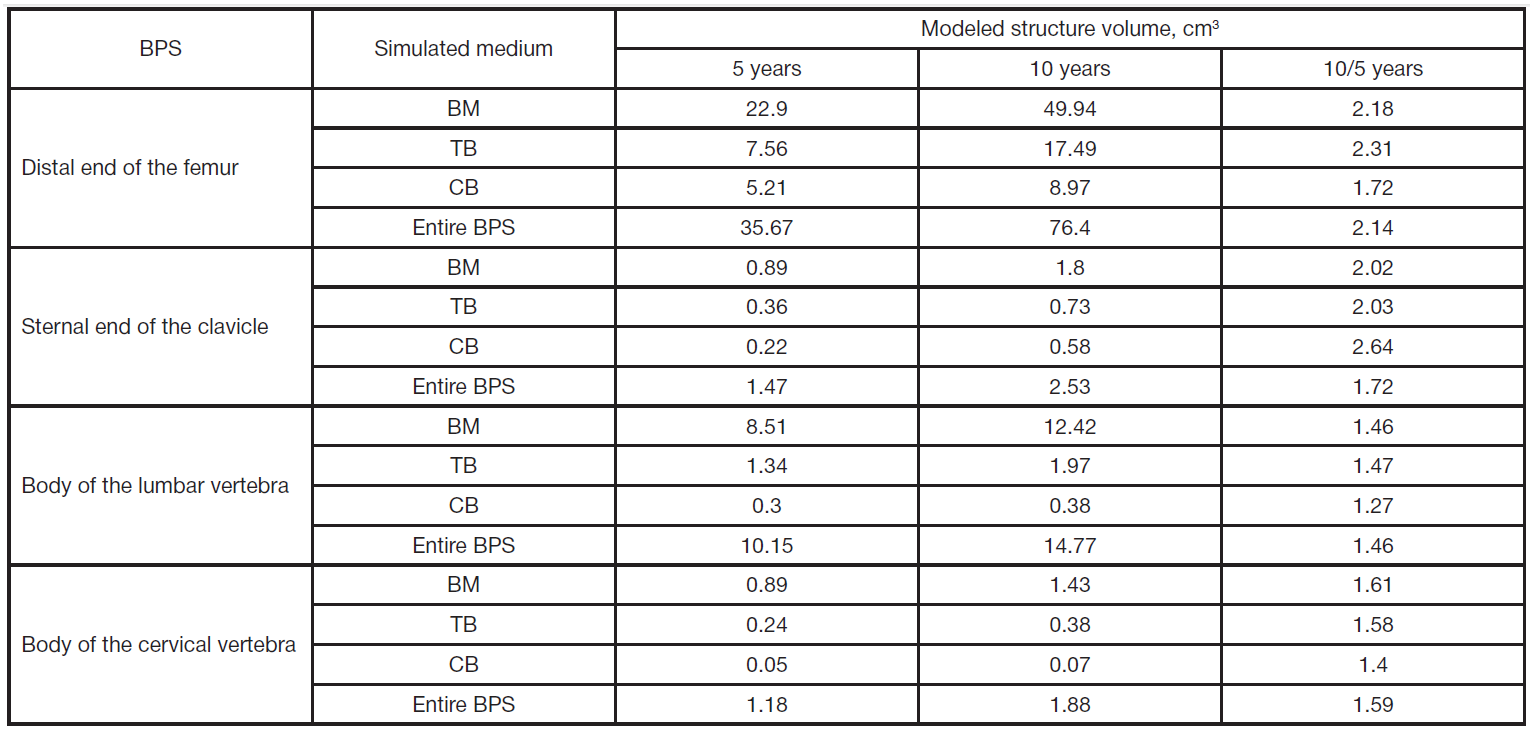
Table 5. Comparison of BPS volumes of five- and ten-year-old children