ORIGINAL RESEARCH

Regulatory T cells and T helper 17 cells expressing CD39 and CD73 ectonucleotidase in children with severe injury

Zakirov RSh1,2, Kuptsova DG1, Freidlin EV1, Semikina EL1, Petrichuk SV1, Karaseva OV1,2
About authors

1 National Medical Research Center for Children's Health, Moscow, Russia

2 Institute of Urgent Children Surgery and Traumatology, Moscow, Russia

Correspondence should be addressed: Rustam Shakirovich Zakirov
Lomonosovsky prospect, 2/1, Moscow, 119296, Russia; ur.dzcn@hsr.vorikaz

About paper

Funding: the study was supported under the State Assignment by the Ministry of Health of Russia, #AAAA–A19–119021190051–6, #122040800163–9

Acknowledgments: the authors express their gratitude to all patients who participated in the study, as well as to colleagues from the department of concomitant injury, anesthesiology and resuscitation of the Research Institute of Emergency Pediatric Surgery and Traumatology of the Moscow Department of Health for their cooperation.

Author contribution: Zakirov RSh, Karaseva OV, Petrichuk SV — study planning, analysis of literature, collection of experimental data, analysis and interpretation of the results, manuscript authoring and editing; Semikina EL — study planning; Kuptsova DG, Freidlin EV — collection of experimental data.

Compliance with the ethical standards: the study was approved by the Ethics Committee of the Institute of Urgent Children Surgery and Traumatology of the Department of Health of Moscow (Minutes #2 of May 26, 2020). Parents of all participants of the study have signed the informed consent form in accordance with the principles of the Declaration of Helsinki.
Received: 2022-11-21 Accepted: 2022-12-11 Published online: 2022-12-24
|
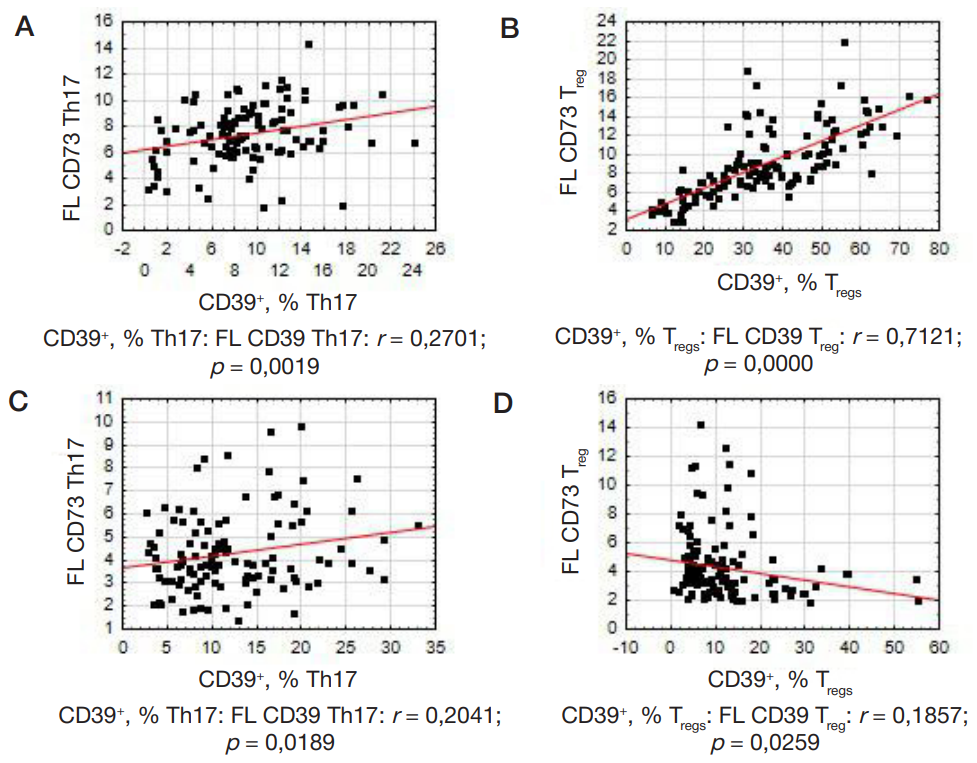
Fig. 1. Dependence of the percentage of Treg and Th17 cells expressing CD39 and CD73 enzymes on the intensity of fluorescence (FL) of CD39 and CD73. A. FL CD39 Th17: CD39+, Th17%. B. FL CD39 Treg: CD39+, Treg%. C. FL CD73 Th17: CD73+, Th17%. D. FL CD73 Treg: CD73+, %Treg
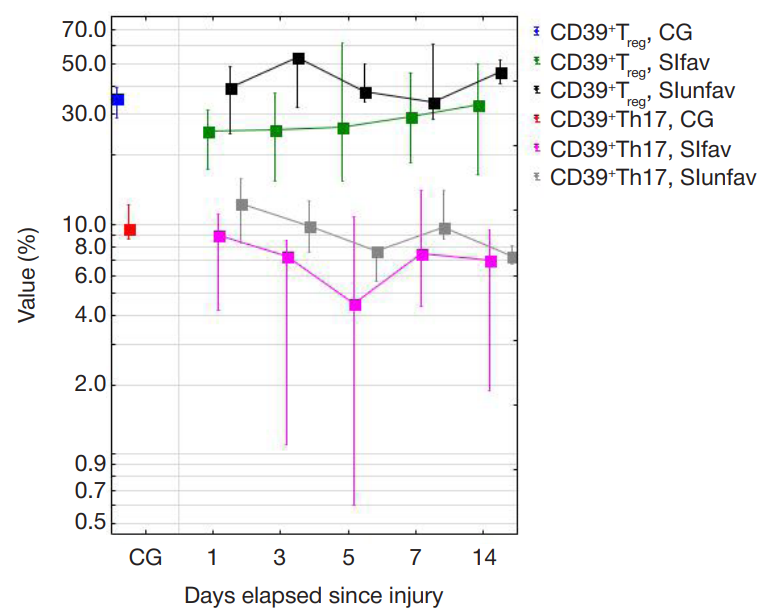
Fig. 2. Relative amount of Th17 and Treg cells expressing CD39, SIfav and SIunfav and control groups. Me [Q25–Q75%]; compared groups: SIunfav, SIfav, control group (CG)
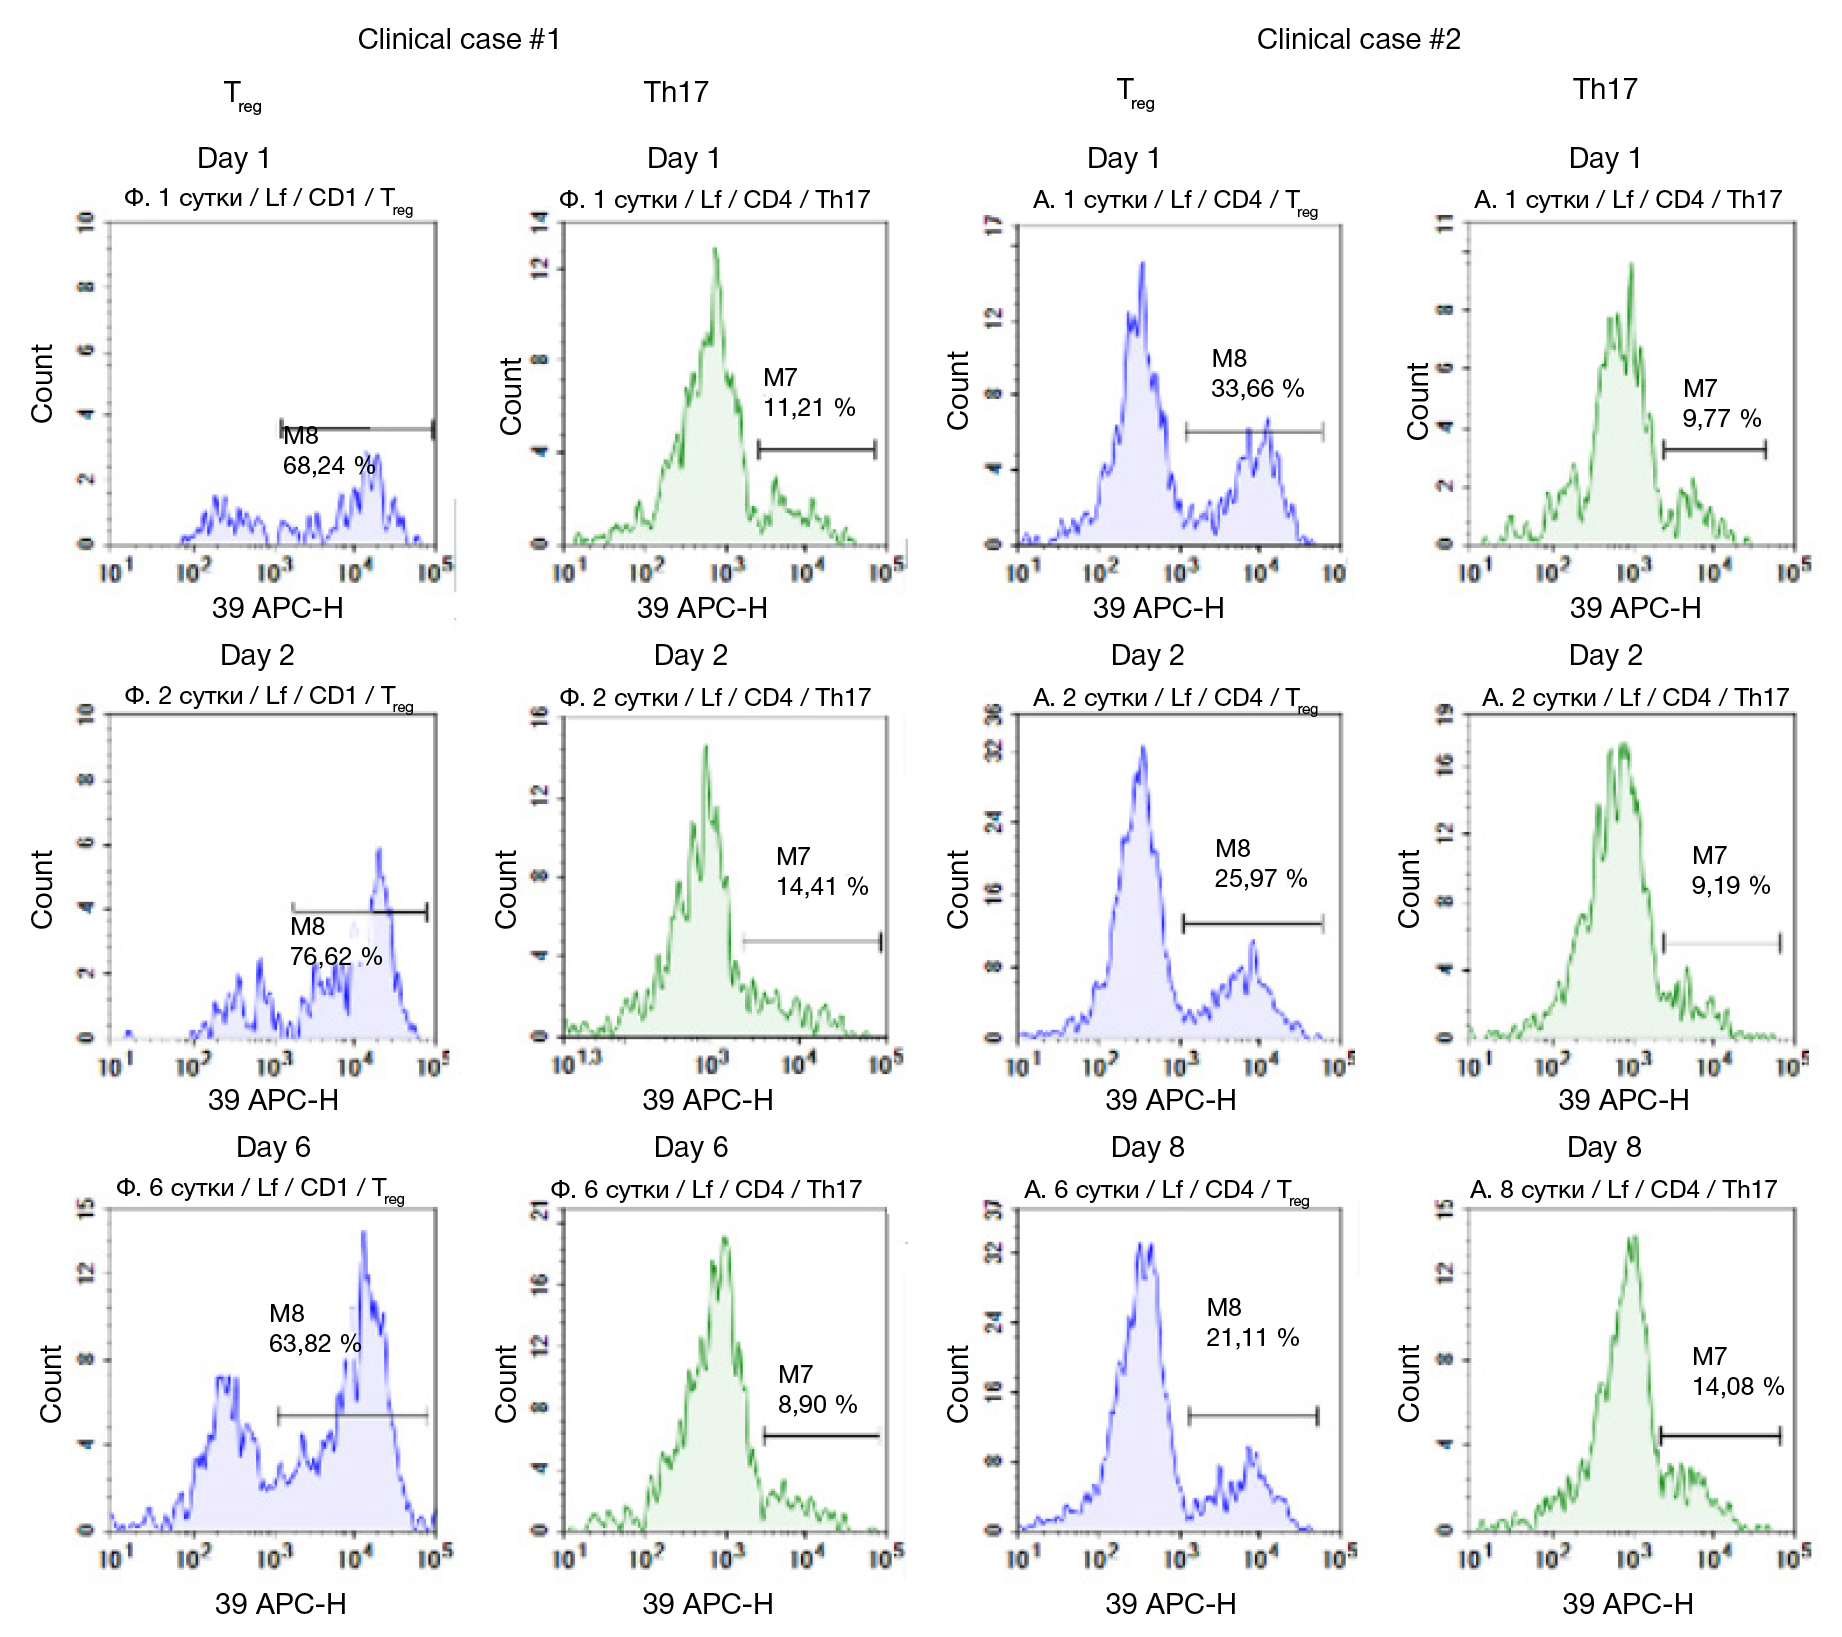
Fig. 3. Dynamics of the relative amount of Th17 and Treg expressing CD39, critical period, severe injury, children with unfavorable (Case #1) and favorable (Case #2) outcome
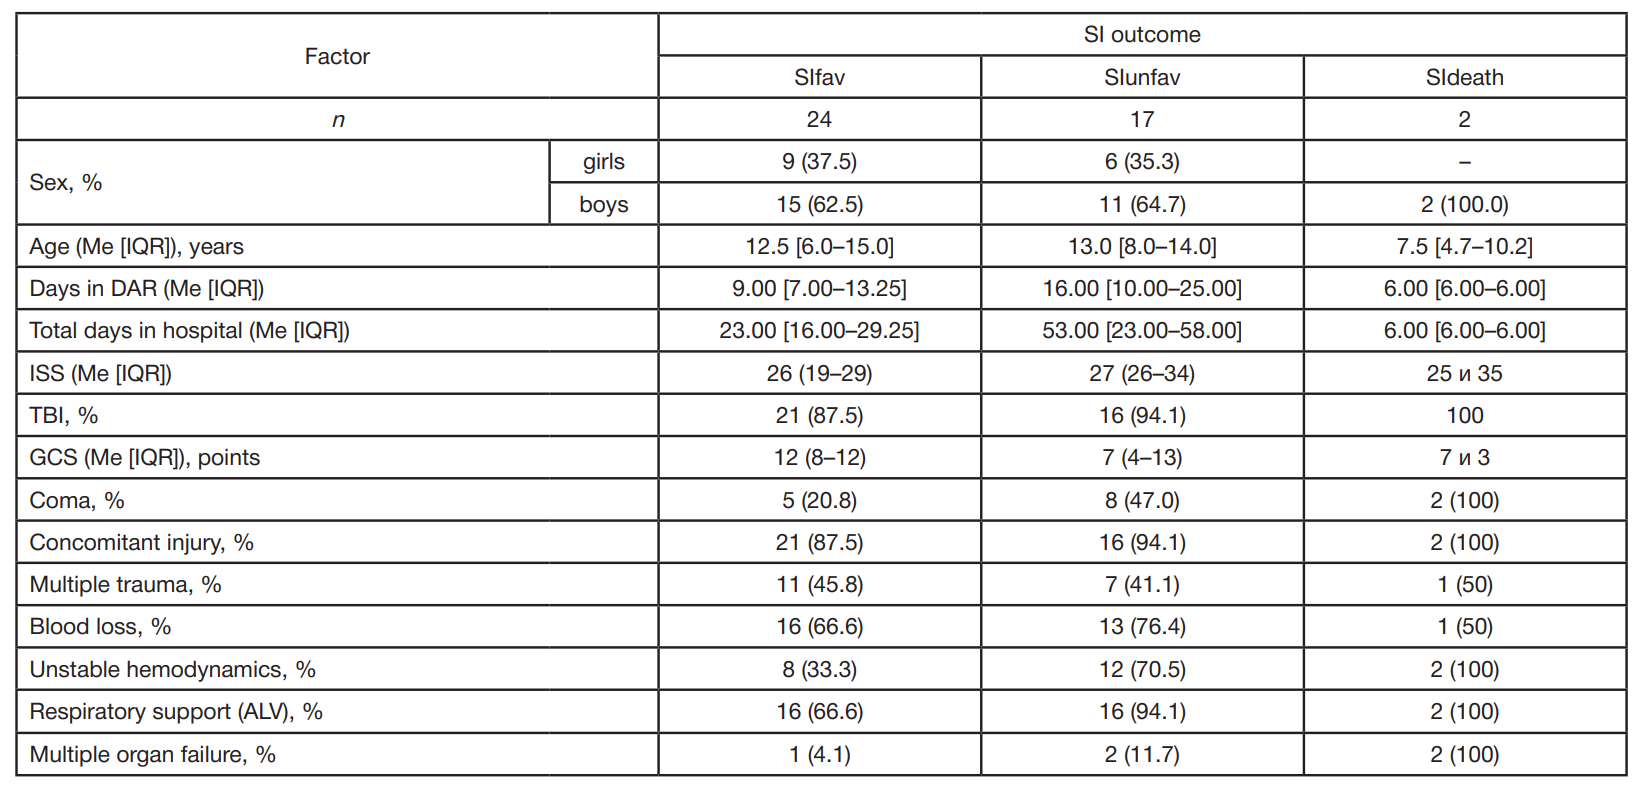
Table 1. Clinical characteristics of patients
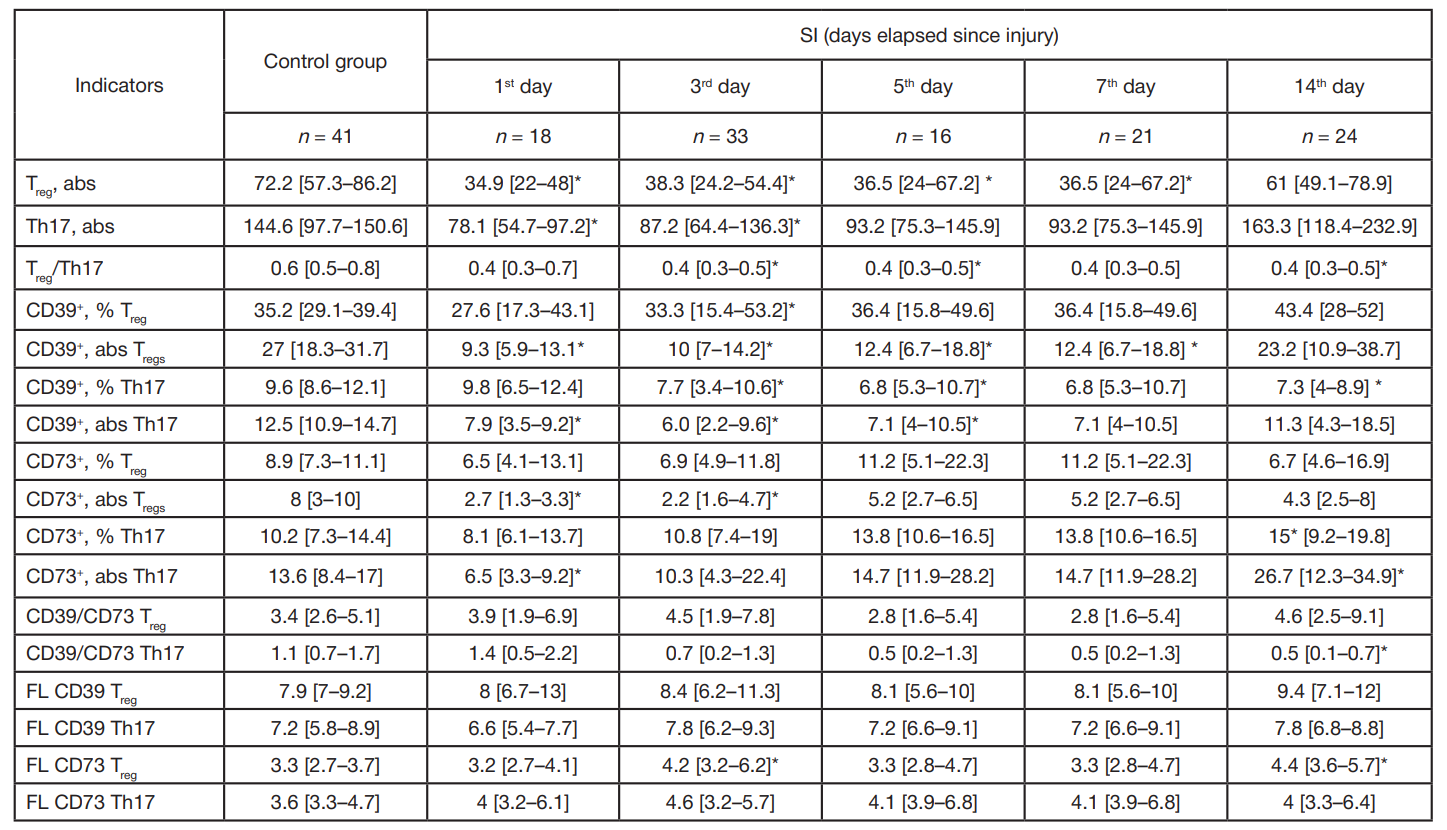
Table 2. Subpopulations of CD4+-lymphocytes, Treg and Th17 expressing CD39 and CD73, and ectonucleotidase fluorescence intensity on Treg and Th17 in SI and control groups, regardless of the traumatic disease outcome
Note: Me [Q25–Q75%]; * — p < 0.05, Mann–Whitney U-test with Bonferroni correction, compared groups (healthy children, SI).
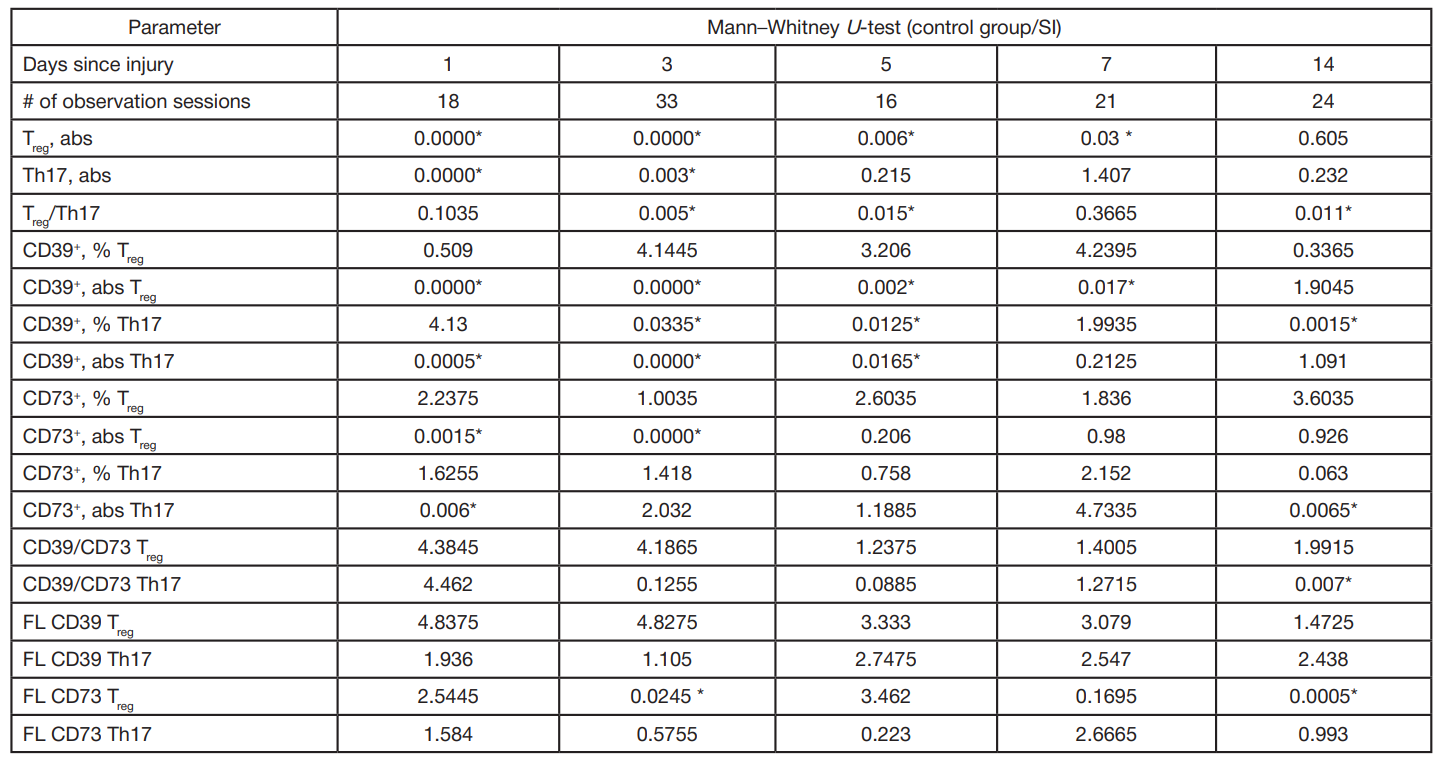
Table 3. Adjusted level of reliability of the analyzed parameters (with Bonferroni correction), control and SI groups, regardless of the traumatic disease outcome
Note: Me [Q25–Q75%]; * — p < 0,05, Mann–Whitney U-test, compared groups (control group, SI).
Table 4. Relative amount of Treg and Th17 cells expressing CD39 and CD73 enzymes, first through third days, children with SI
Note: Me [Q25–Q75%]; Mann–Whitney U-test, compared groups: SIunfav, SIfav.
Table 5. Fluorescence parameters (FL) of CD39 and CD73 purinergic signaling on Treg and Th17, critical period, SI, children
Note: Me [Q25–Q75%]; p is the adjusted significance level (Bonferroni correction applied); * — p < 0.05 significance level, Mann–Whitney U-test, compared groups (SIfav and SIunfav on the first, third, fifth, seventh, and 14th days post injury).