ORIGINAL RESEARCH

Identification of staphylococcal enterotoxin B in dairy products by immunochromatography with visual and digital video detection

About authors

State Scientific Research Institute of Biological Engineering of the Federal Medical Biological Agency, Moscow, Russia

Correspondence should be addressed: Sergey P. Yarkov
Volokolamskoe shosse, 75, korp. 1, Moscow, 125424, Russia; ur.lod@losaid

About paper

Funding: the study was conducted as part of the State Assignment of the Federal Medical Biological Agency of Russia (GK № 42.001.22.6).

Author contribution: Yarkov SP — concept, part in developing the “Zondazh” unit, planning the experiments and analysis of the results, manuscript draft; Tretyakov SI — developing immunochromatography tests, experiments with dairy products, analysis of the study results; Shilenko IV — developing immunochromatography tests, experimental procedure, analysis of the results; Ishkov YuN — day-to-day research management, manuscript editing; Styazhkin KK — general management, manuscript editing.
Received: 2023-08-24 Accepted: 2023-09-18 Published online: 2023-09-30
|
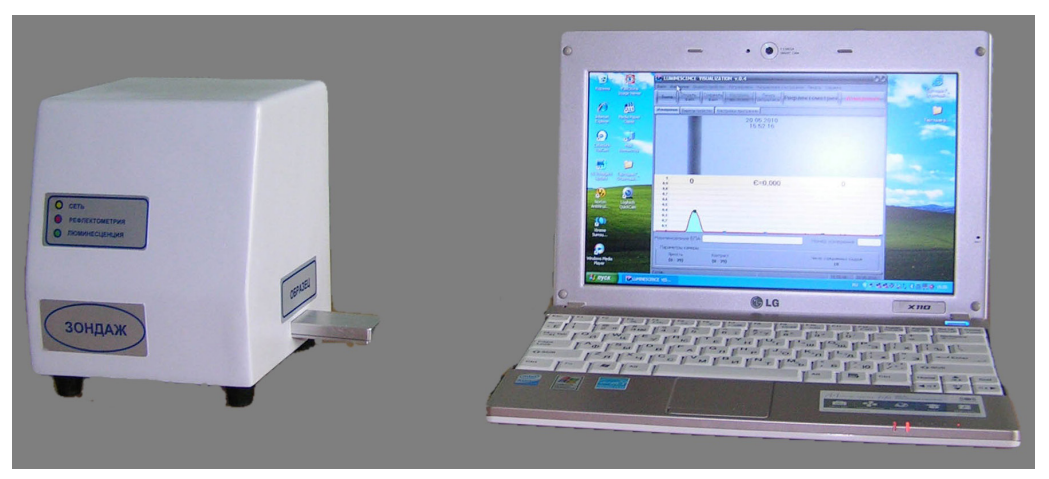
Fig. 1. Zondazh reflectometer-fluorimeter
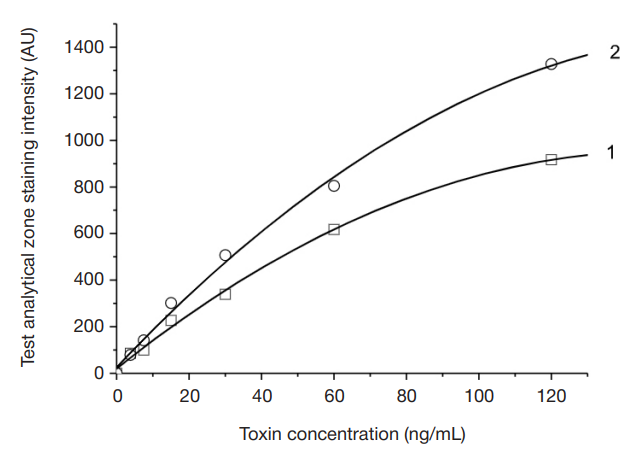
Fig. 2. Graphs of the relationship between the test analytical zone staining intensity and the SEB concentration in buffer solution measured using the Zondazh reflectometer-fluorimeter: 1 — illumination with white light (λ = 400–800 nm); 2 — illumination with green light (λmax = 525 nm). Chromatography time 25 min
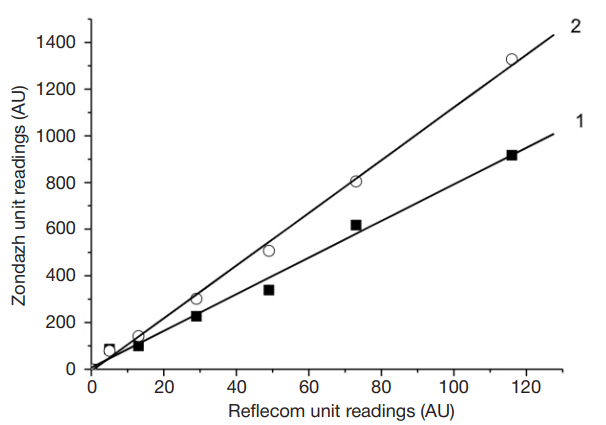
Fig. 3. Graphs of the correlation between the readings of the Reflecom and Zondazh reflectometers used to measure the test analytical zone staining intensity in the SEB concentration range of 0–120 ng/mL. 1 — illumination with white light, 2 — illumination with green light, correlation coefficients of linear relationships R = 0.995 and R = 0.999, respectively
Fig. 4. Chart reflecting sensitivity of SEB detection in dairy products using visual recording of the results or instrumental recording with the Zondazh reflectometer-fluorimeter. 1 — SEB solution in buffer; 2 — milk, 3.2% fat; 3 — cream, 10% fat; 4 — sour cream, 10% fat; 5 — cheese, 50% fat
Table 1. ICT analytical properties when detecting SEA and SEB using visual recording of the results
Note: there were no cross-reactions between SEA and SEB concentrations 100 times higher than the corresponding ICT sensitivity; the toxin solutions were prepared using a buffer solution for immunochromatography analysis.
Table 2. The test analytical zone staining intensity depending on the SEB concentration and the light spectral range measured using DVR instruments
Note: the instrument readings provided in the table are mean values of five measurements. The error represents a standard error at the 95 % confidence level 95%, multiplied by the coefficient ts = 2.776 of Student’s t-distribution for four degrees of freedom. Calculations were performed using MS Excel.