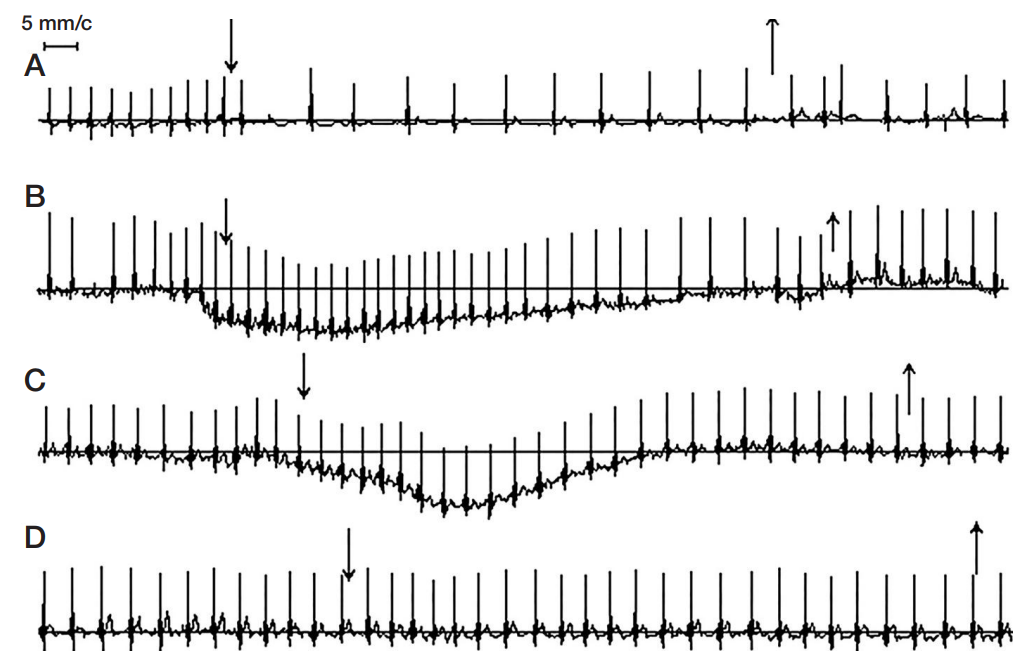
Fig. 1. Types cardiovascular system's response to immersion of face in water (types of diving reaction): highly reactive (A), reactive (B), areactive (C), paradoxical (D). Down arrow — immersion, up arrow — withdrawal from water

Fig. 2. Changes in the cardiovascular system characteristics during CHT. ECG — electrocardiogram, IRGT — Tishchenko integral rheogram, IRGTd — IRGT pulse ware differential curve, PPG — photoplethysmogram (distal phalanx of the thumb), PPGd — PPG pulse differential wave curve, RPG — shoulder rheoplethysmogram, RPGd — RPG pulse wave differential curve. Vertical lines — beginning and end of the test with face immersion in water
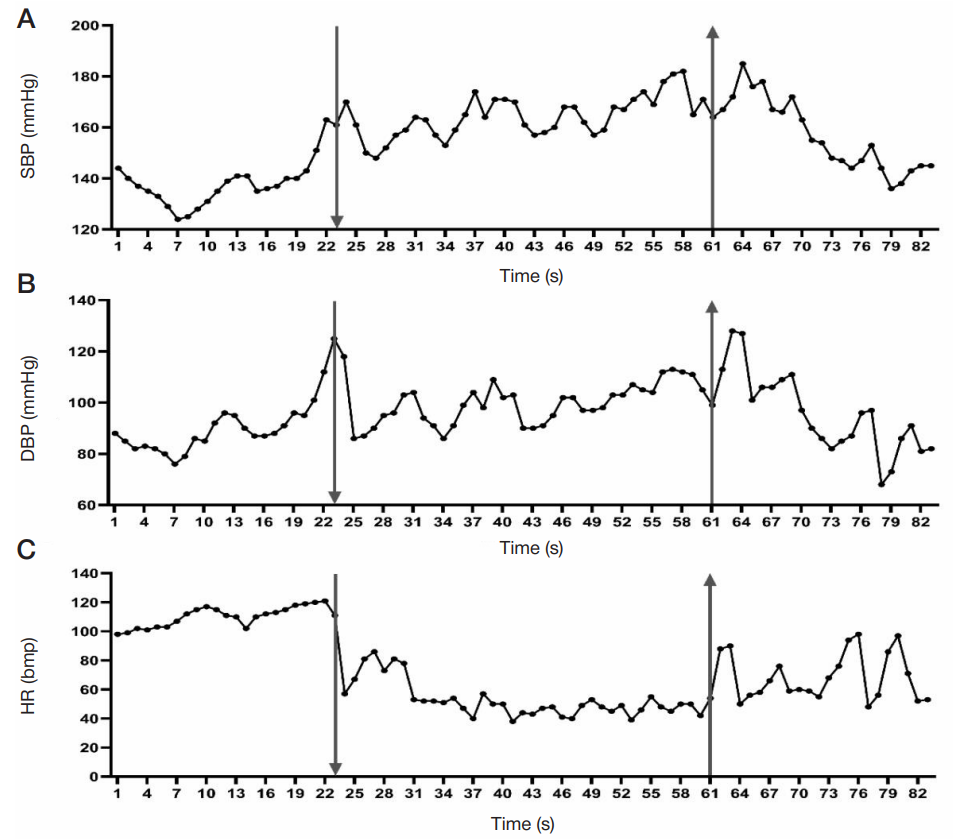
Fig. 3. Dynamics of blood pressure: systolic (SBP) (A), diastolic (DBP) (B), heart rate (HR) (C). Abscissa axis — time, ordinate axis for A and B — mmHg, for C — beats/minute. Down arrow — CHT begins, up arrow — CHT ends

Fig. 4. CHT-triggered changes in systolic blood pressure. Abscissa axis: background — resting state, lying back up; CHT2 — second face immersion test; CHT3 — third face immersion test. Ordinate axis — systolic pressure, mmHg * * — p < 0.01 — significance of differences. Highly reactive type — n = 18; reactive — n = 23; areactive — n = 24; paradoxical — n = 15
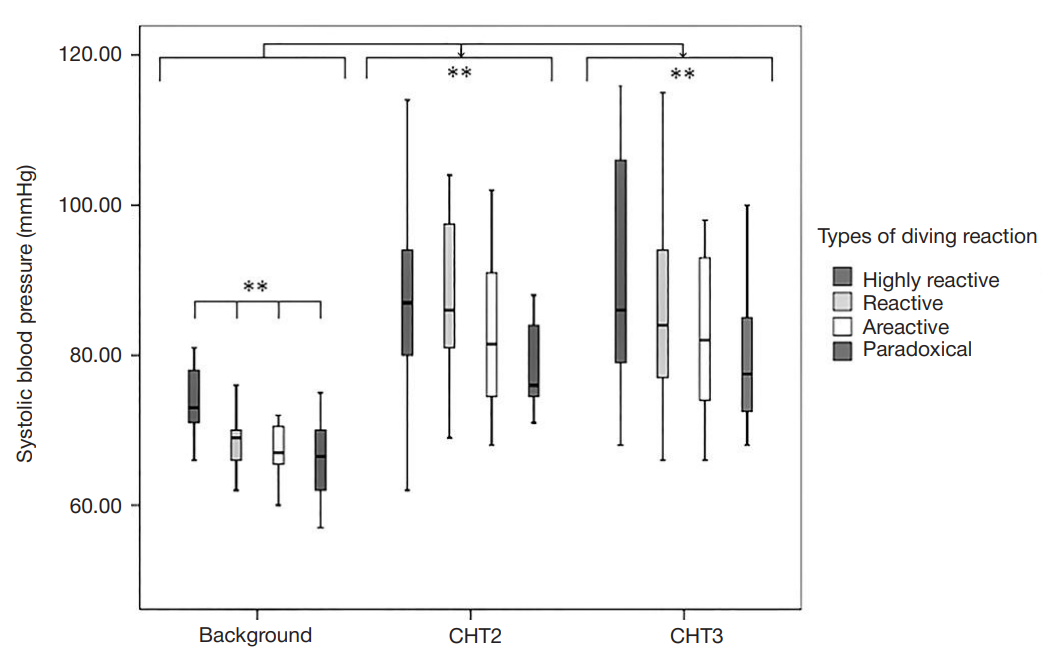
Fig. 5. CHT-associated changes in diastolic blood pressure. Second (CHT2) and third (CHT3) immersions. Ordinate axis — diastolic pressure, mmHg. Other indicators as in Fig. 5. * * — p < 0.01. Highly reactive type — n = 18; reactive — n = 23; areactive — n = 24; paradoxical — n = 15
Table 1. Changes in the cardiovascular system characteristics at rest and during simulated diving, men and women (n = 80)
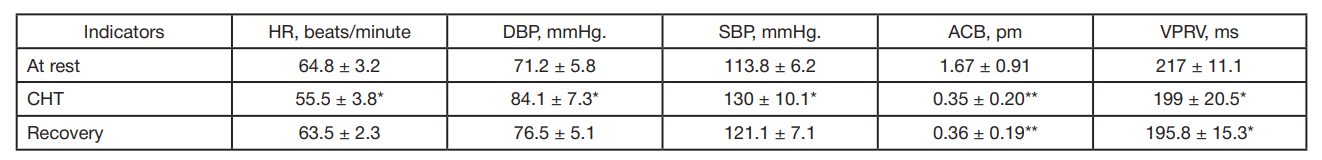
Note: SBP — systolic pressure, DBD — diastolic pressure, ACB photoplethysmogram pulse wave amplitude, VRPV — pulse wave propagation time. * — p < 0.05; * * — p < 0.01 — at comparison of the indicators during CHT and at the initial resting state.
Table 2. Temporal ECG indicators at rest and during CHT, participants of various types of reactivity
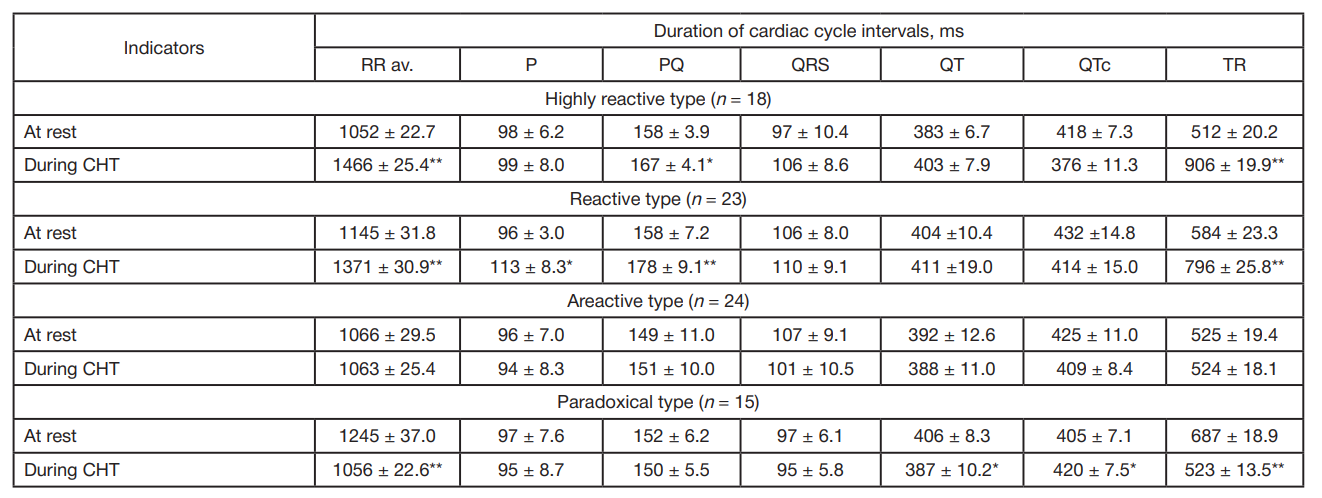
Note: reliability of differences between the initial state and during CHT. * — p < 0.05, * * — p < 0.01.
Table 3. Changes in blood pressure levels (mmHg) caused by the 6-week cold-hypoxia training course (n = 40)

Note: °,* — p < 0.05; °° — p < 0.01; * — significance of differences before and after the training course; ° — significance of differences between CHT-associated and initial state indicators.
Table 4. Changes in cardiac conduction before and after swimming (water temperature t = +8 °C)
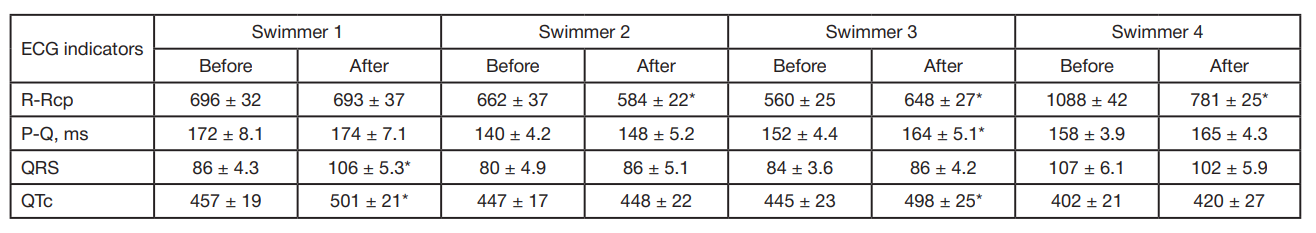
Note: before — initial state before the swim, after — 30–40 minutes of recovery after the relay swim. * — p < 0.05, Student's t-test used to analyze individual post-swim data against the initial state (ECG recording time — 5 minutes).
Table 5. Changes in cardiac conduction before and after swimming (water temperature t = +17 °C)
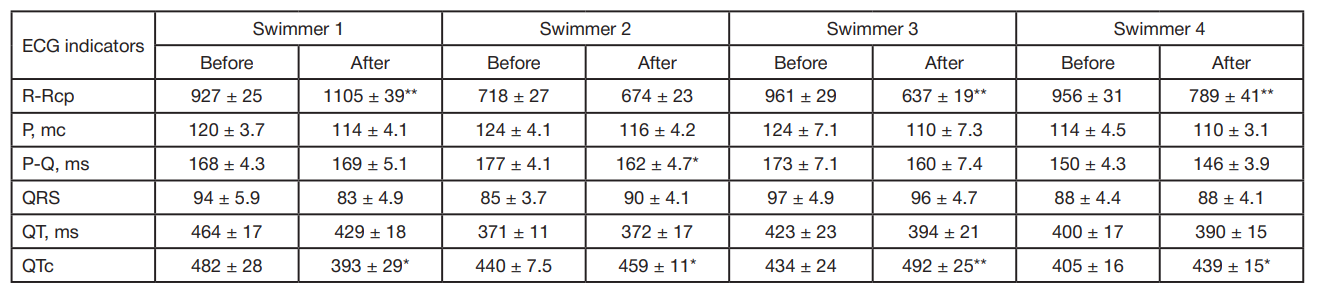
Note: before — initial state before the swim, after — 30–40 minutes of recovery after the relay swim. * — p < 0.05; * * — p < 0.01, Student's t-test used to analyze individual post-swim data against the initial state (ECG recording time — 5 minutes).