ORIGINAL RESEARCH

Impact of persistent cold stress on spectral characteristics of EEG alpha and theta rhythms in military academy cadets

Tolstoguzov SN1, Fisher TA2, Naida YuV1, Lepunova ON1
About authors

1 University of Tyumen, Tyumen, Russia

2 Proshlyakov Tyumen Higher Military Engineer Command School, Ministry of Defence of the Russian Federation, Tyumen, Russia

Correspondence should be addressed: Sergey N. Tolstoguzov
Volodarskogo, 6, Tyumen, 625003, Russia; ur.nmtu@vozugotslot.n.s

About paper

Author contribution: Tolstoguzov SN — research procedure, data analysis, manuscript writing; Fisher TA — data analysis, manuscript writing; Naida YuV — research procedure; Lepunova ON — data analysis.

Compliance with the ethical standards: the study was approved by the Ethics Commitee of the University of Tyumen (protocol № 11 dated 19 February 2024). All patients submitted the informed consent to stady participation.
Received: 2024-02-20 Accepted: 2024-03-21 Published online: 2024-03-31
|
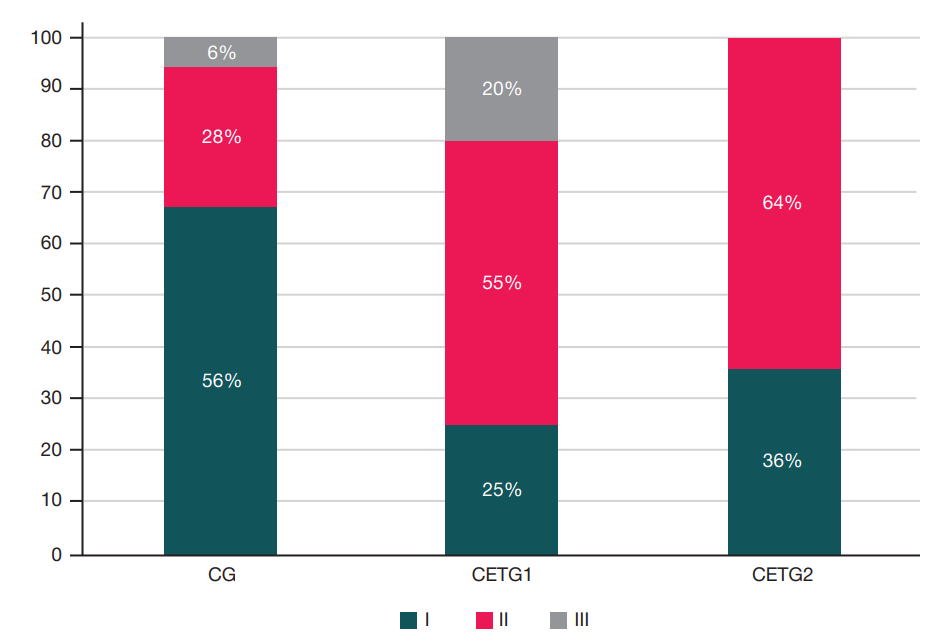
Fig. 1. Proportions of various EEG types in the samples of subjects [1]. CG — control group, CETG1 — experimental group 1 undergoing cold exposure training, CETG2 — experimental group 2 undergoing cold exposure training
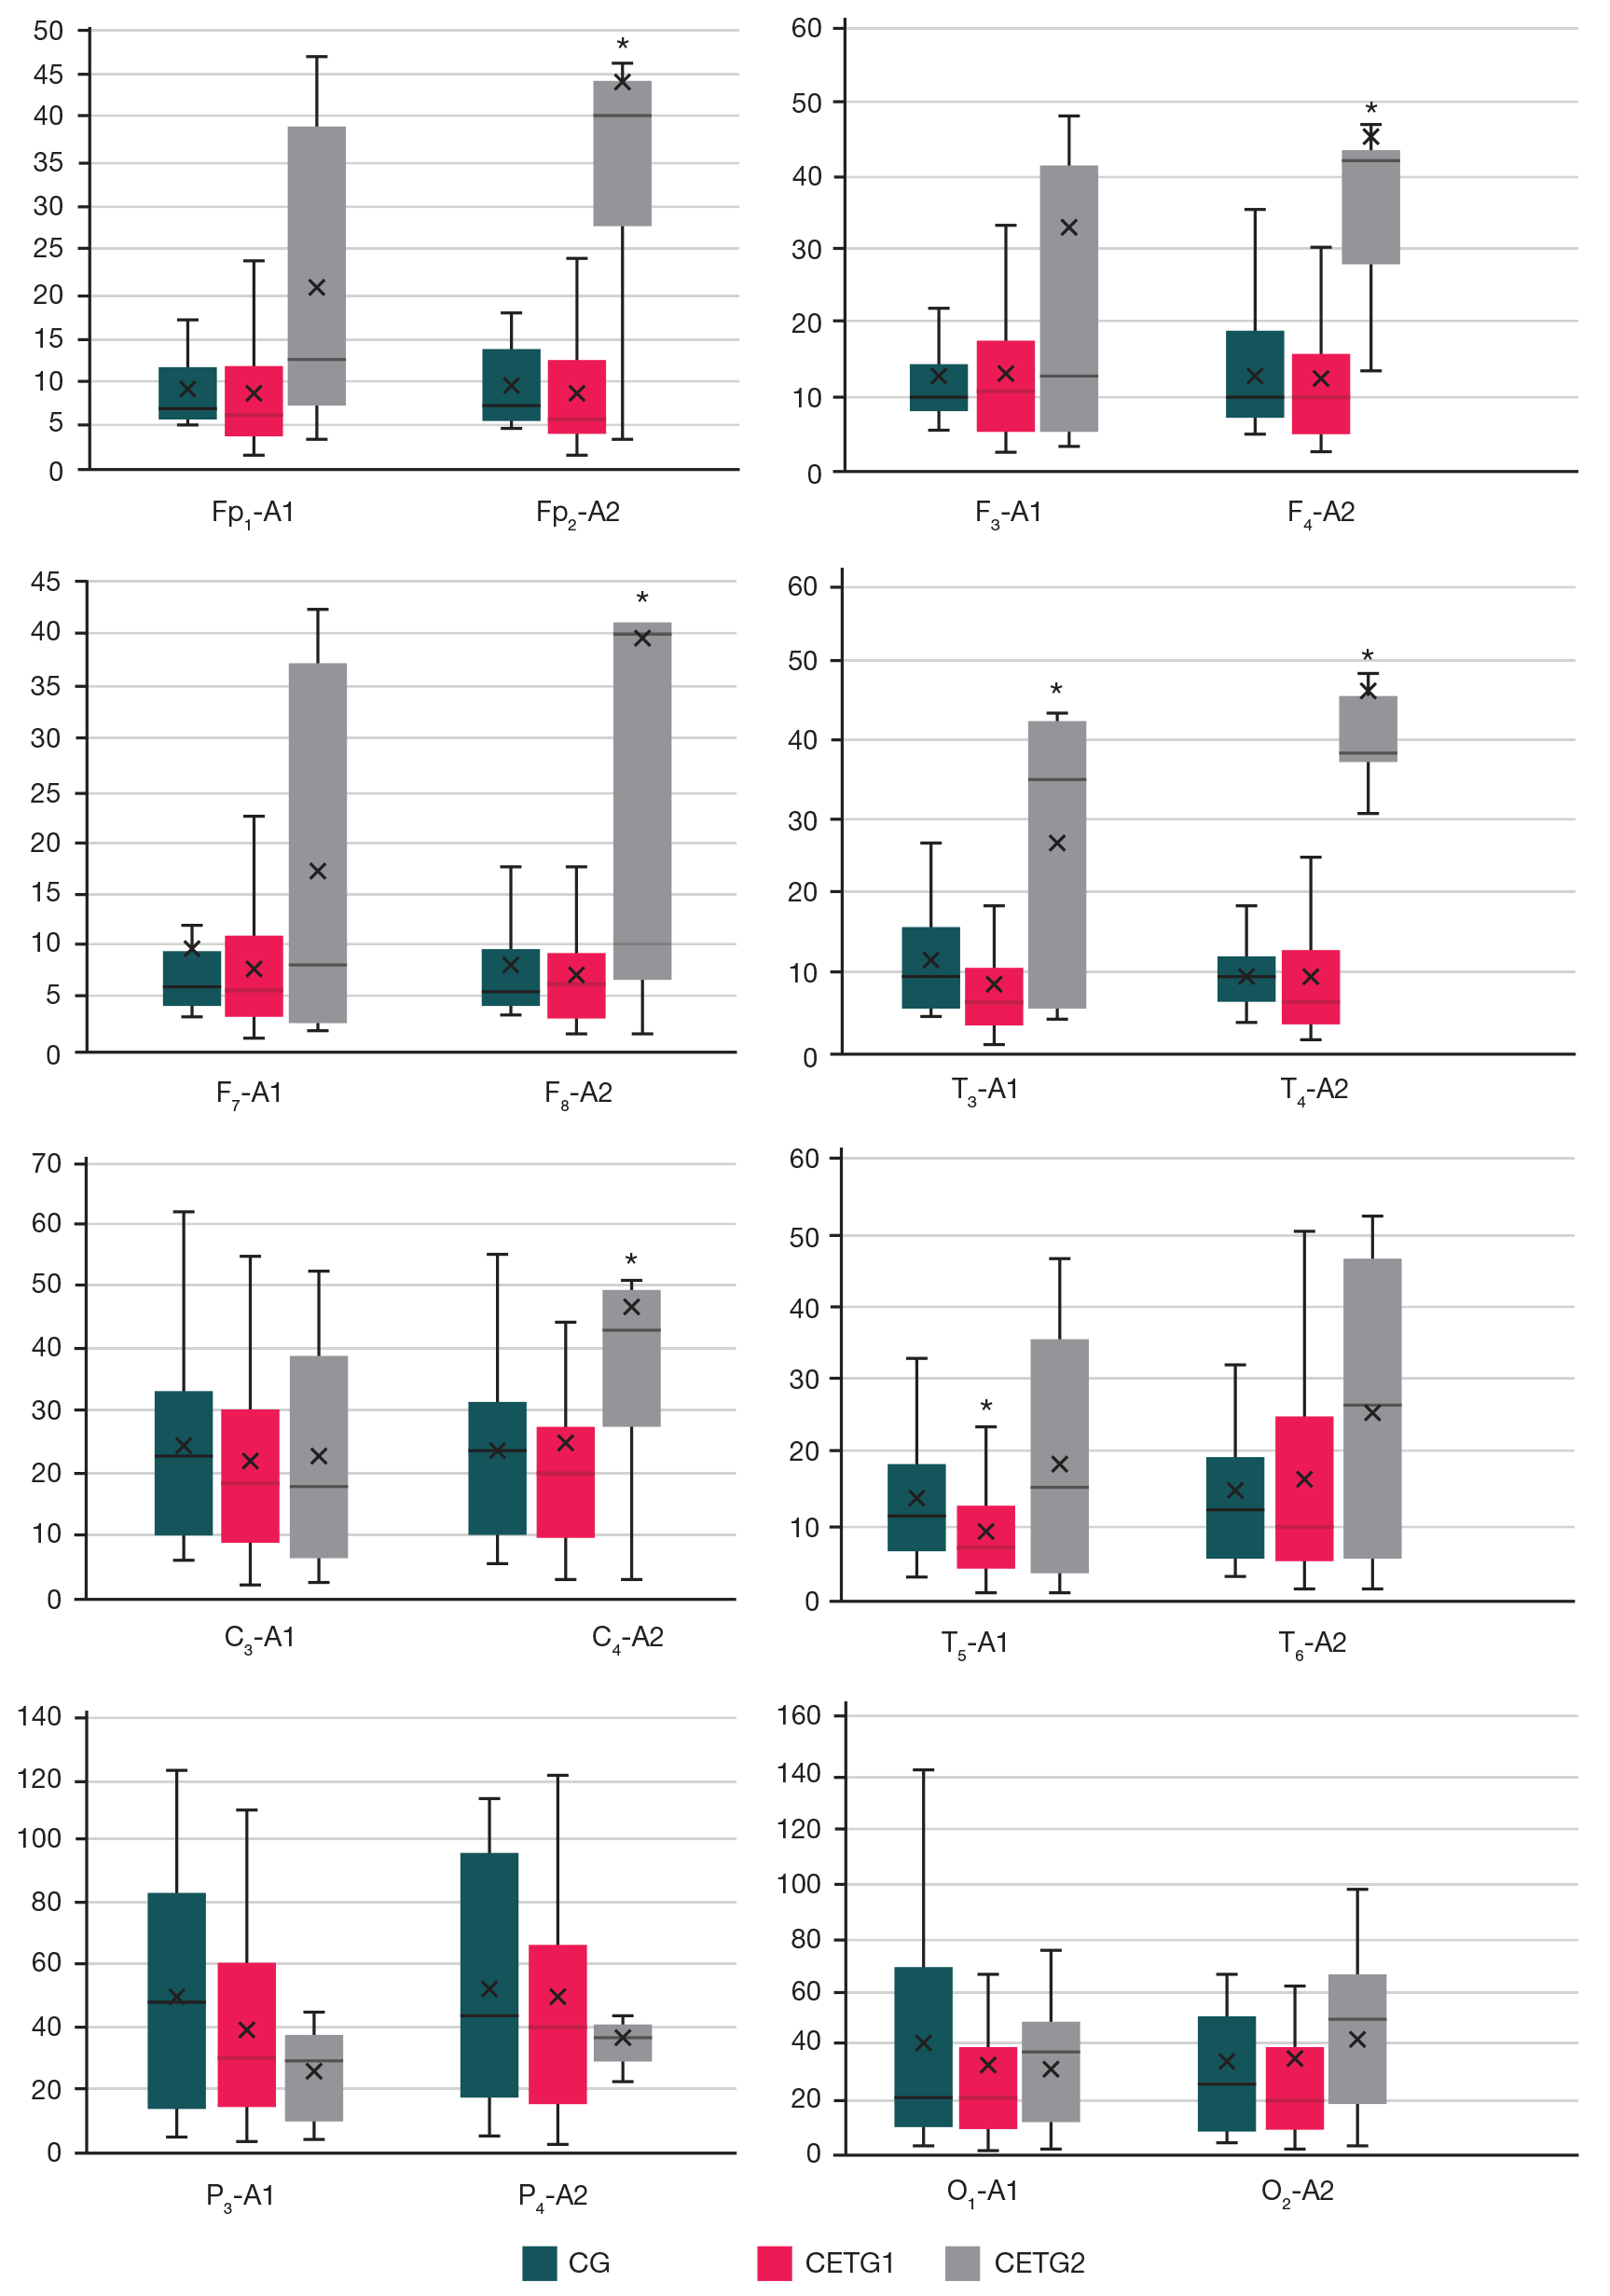
Fig. 2. Total spectral power (µV2) in the theta range (4–8 Hz) in 16 major leads. The box margins correspond to quartiles Q25% and Q75%. Lines inside the boxes — medians, crosses in the box — average values, upper and lower deviations — maximum and minimum values. * — significance of differences from the control group (р < 0.05) based on the Mann–Whitney U test. CG — control group, CETG1 — experimental group 1 undergoing cold exposure training, CETG2 — experimental group 2 undergoing cold exposure training
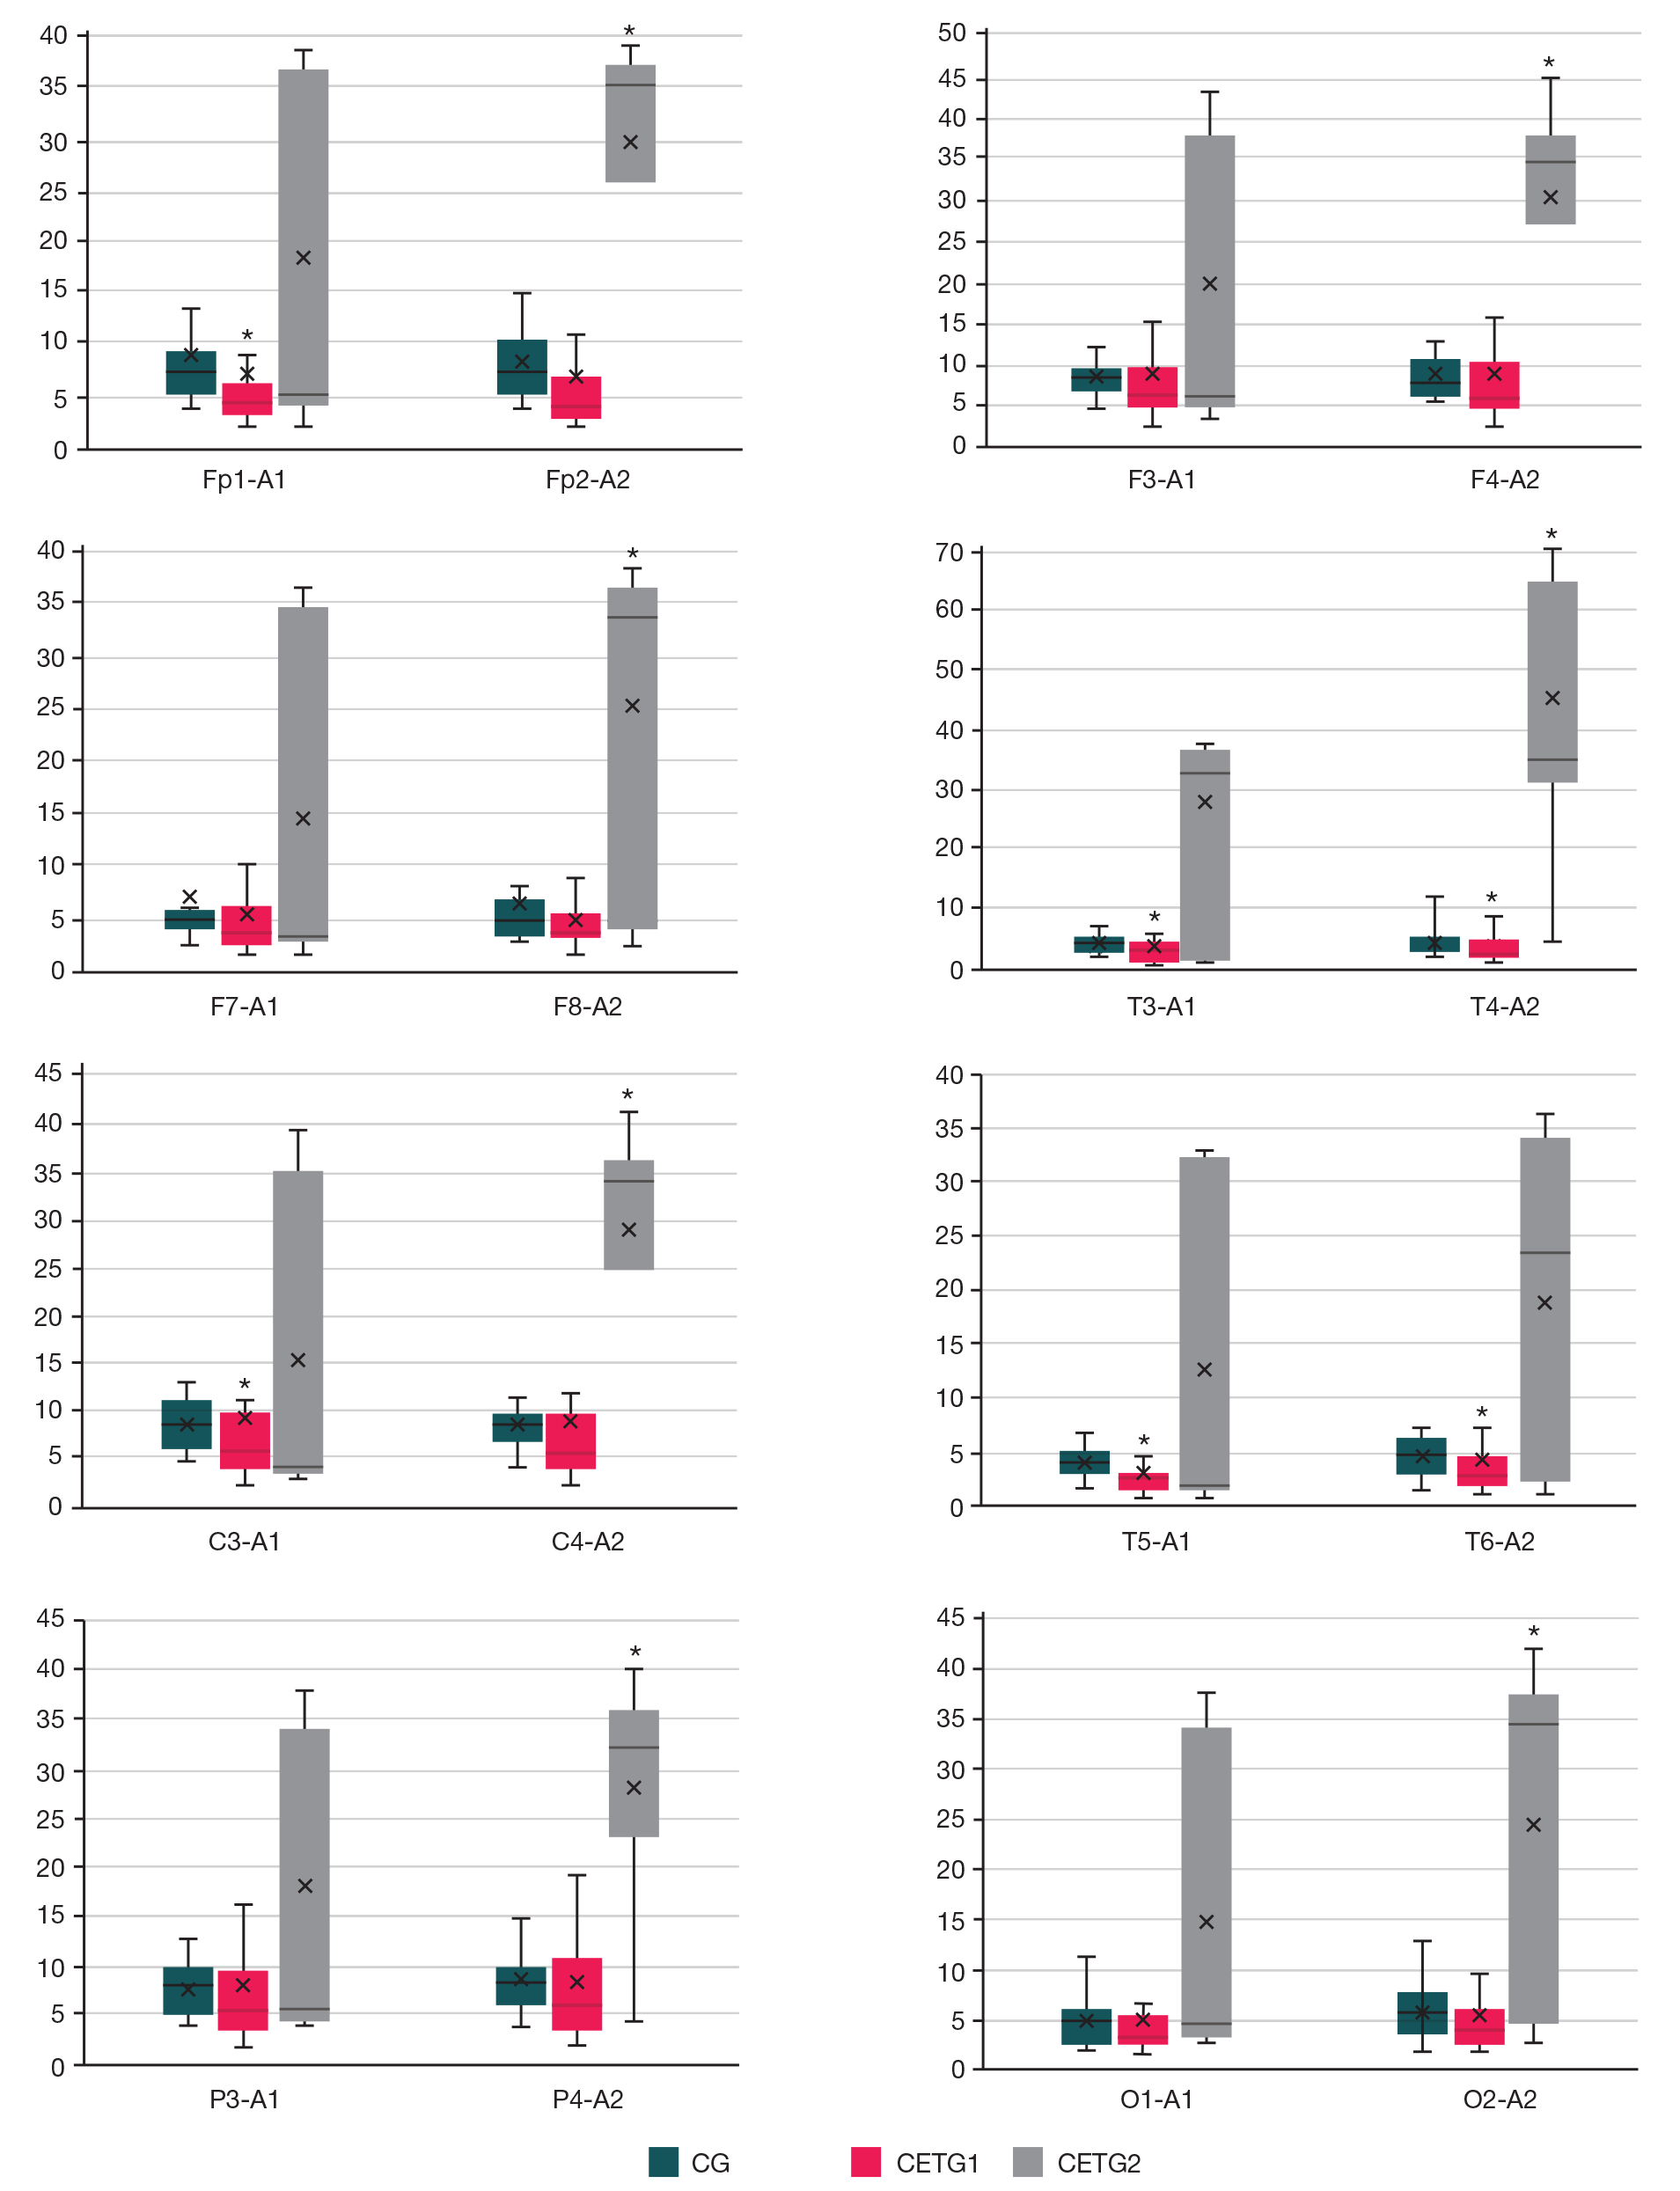
Fig. 3. Total spectral power (µV2) in the alpha range (8–14 Hz) in 16 major leads. The box margins correspond to quartiles Q25% and Q75%. Lines inside the boxes — medians, crosses in the box — average values, upper and lower deviations — maximum and minimum values. * — significance of differences from the control group (р < 0.05) based on the Mann–Whitney U test. CG — control group, CETG1 — experimental group 1 undergoing cold exposure training, CETG2 — experimental group 2 undergoing cold exposure training
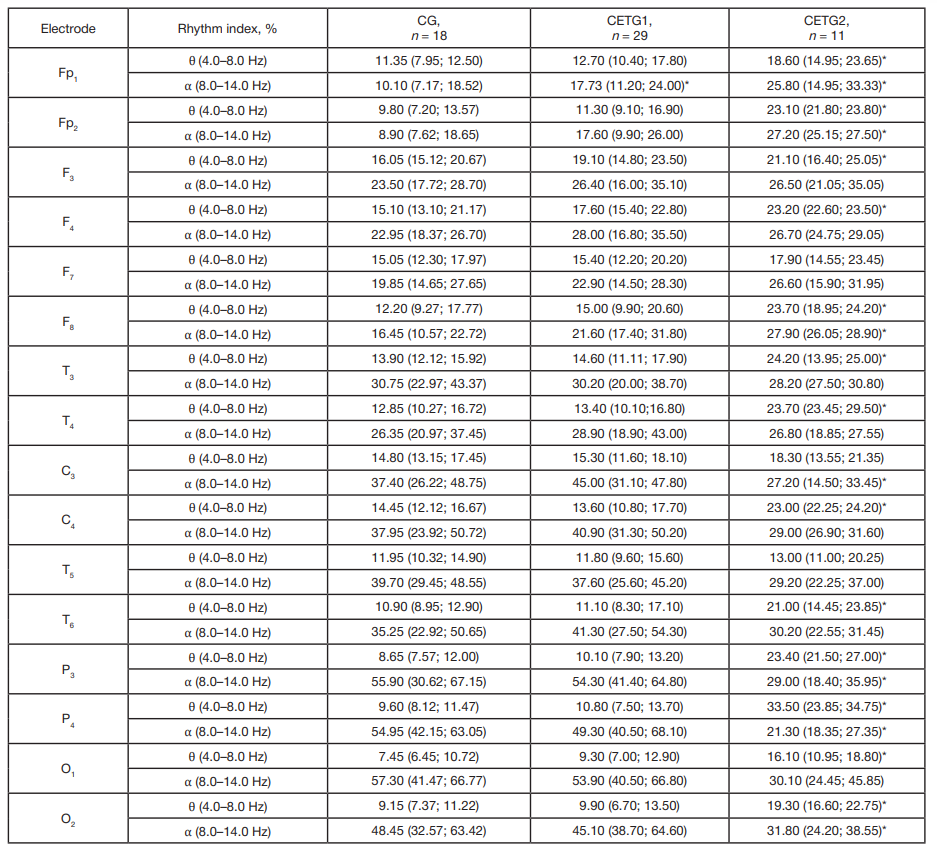
Table 1. EEG theta and alpha rhythm indices (%) in major leads. Median (quartiles Q25%; Q75%)
Note: * — significance of differences from the control group (р < 0.05) based on the Mann–Whitney U test. CG — control group, CETG1 — experimental group 1 undergoing cold exposure training, CETG2 — experimental group 2 undergoing cold exposure training.
Table 2. Integrated EEG indices (alpha/theta) averaged over all leads. Median (quartiles Q25%; Q75%)
Note: р — significance of differences from the control group based on the Mann–Whitney U test. CG — control group, CETG1 — experimental group 1 undergoing cold exposure training, CETG2 — experimental group 2 undergoing cold exposure training.